From concept to community
At it's core run clubs are just a community of people that choose to run together.
Queers Run Brooklyn (QRB) is an Brooklyn-based social run club for the queer community. At the start of this project QRB existed only in concept.
This case study describes how as design chair I developed the systems and tools turned this concept into a functional community that meets that defintion.
Purpose
To develop the visual and communication foundations that support the daily functioning of QRB and the acquisition of aligned new members.
Challenges
There were two key challenges in for this project.
First was identity differentiation. There were three other NYC queer run clubs at the time QRB was formed. I needed to ensure I developed a distinct visual identity that clearly reflected QRB's value.
Second was communication system functionality. QRB's volunteer led run structure, which is a critical part of this clubs identity made it difficult for the social media chair to inform members about runs on time causing them to miss runs. As volunteers sign up late, and having a different route 6x a week means sharing information is vital and creating posts in a standard way with that information is difficult.
Solutions
To develop a distinct identity, my research led to the development of a functional ethos aligned design system that highlights QRB's sporty-friendly position and unique trans-exclusive offerings.
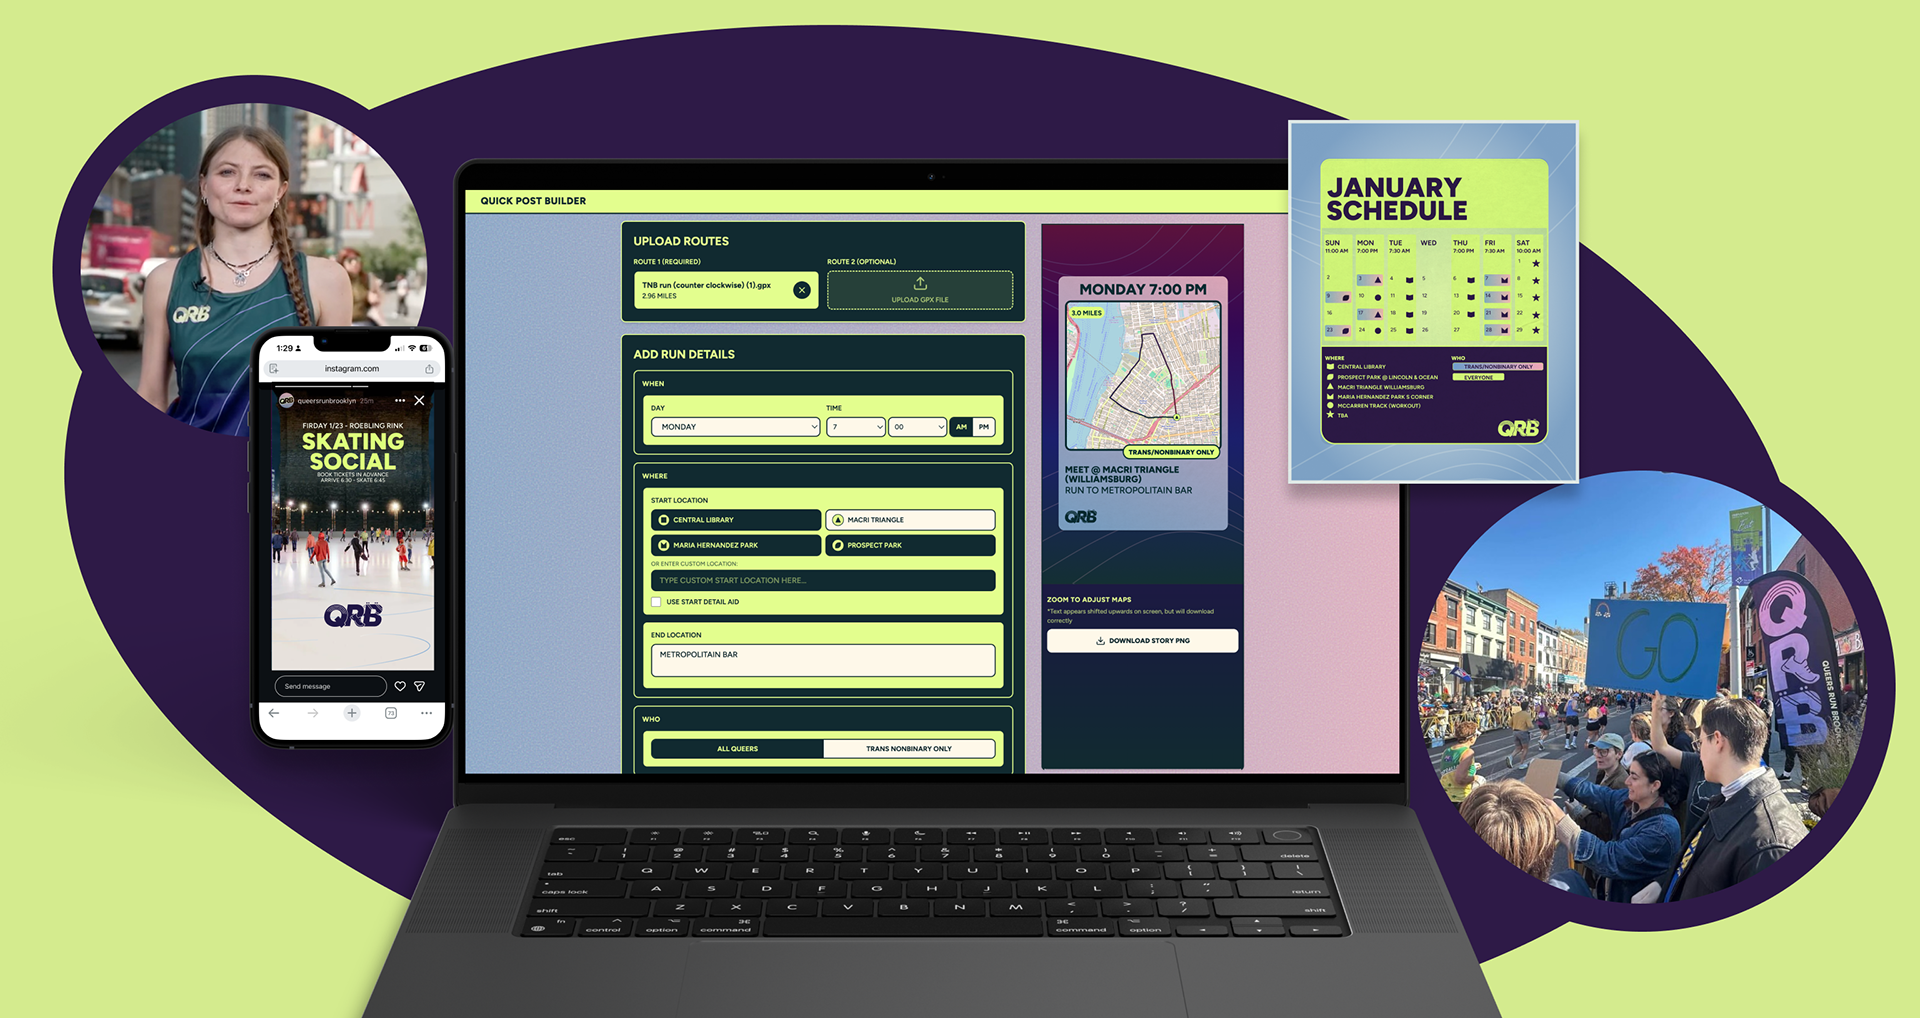
To support communication, I created a monthly calendar and story post system that bridge the time gap of to ensure members learn about runs in a timely manner along with QRB Quick Post Builder, an application that automates the social media chair's daily run post design process to make creating accurate design aligned posts easy.
Ultimately, I did not just creating a few branded images I built a well thought out a supported communication ecosystem that form a community that positively impacts peoples lives.
cONTRIBUTION HIGHLIGHTS
Established a visual identity for QRB, building a functional design system and applied it across platforms and physical products.
Increased social media manager capacity by 85% for standard runs and 97% in edge cases through building an automated and operational workflow for day of run communication with a functional website that generates post-ready images from a Strava route data.
Formed a design committee and led meetings to ensure proper direction and iterate on designs.
TOOLS
Personas, Competitive Analysis, Think Aloud Interviews, Card Sorting Activities, AB Testing, Current State Diagraming, Journey Mapping, Rapid Prototyping, Wireframing
.
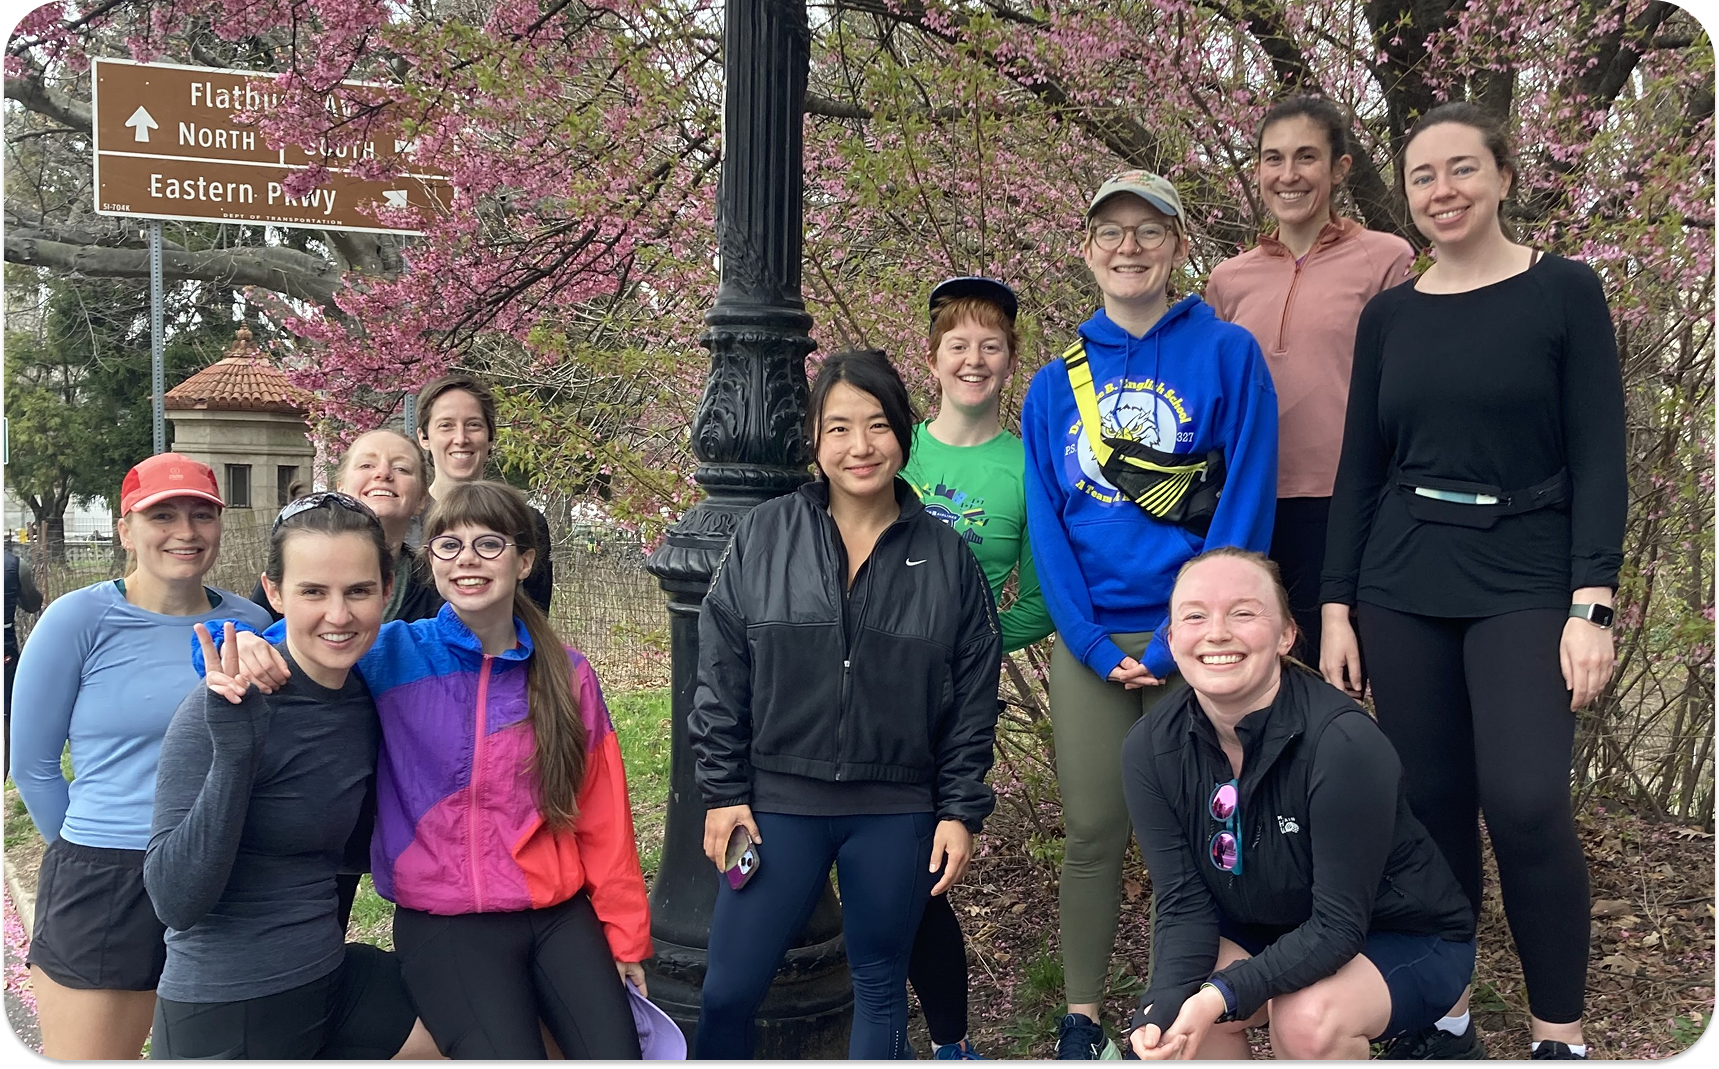
Challenge 1/2
Identity
How might we develop a distinct visual identity that reflects our community's values?
-
.
Understanding the Community
To develop designs that represented QRB, I first needed to understand what I was representing.
Mission & Values
In our first meetings as a club we established QRB's mission &values to ensure all our choices were aligned going forward.
— To be a space for queer people to run and build genuine friendships.
Core values — Inclusivity, Support, Joy.
Given this prioritization, I knew the athleticism our activities and joy of community had to be reflected in the tone of our materials.
Target Audience
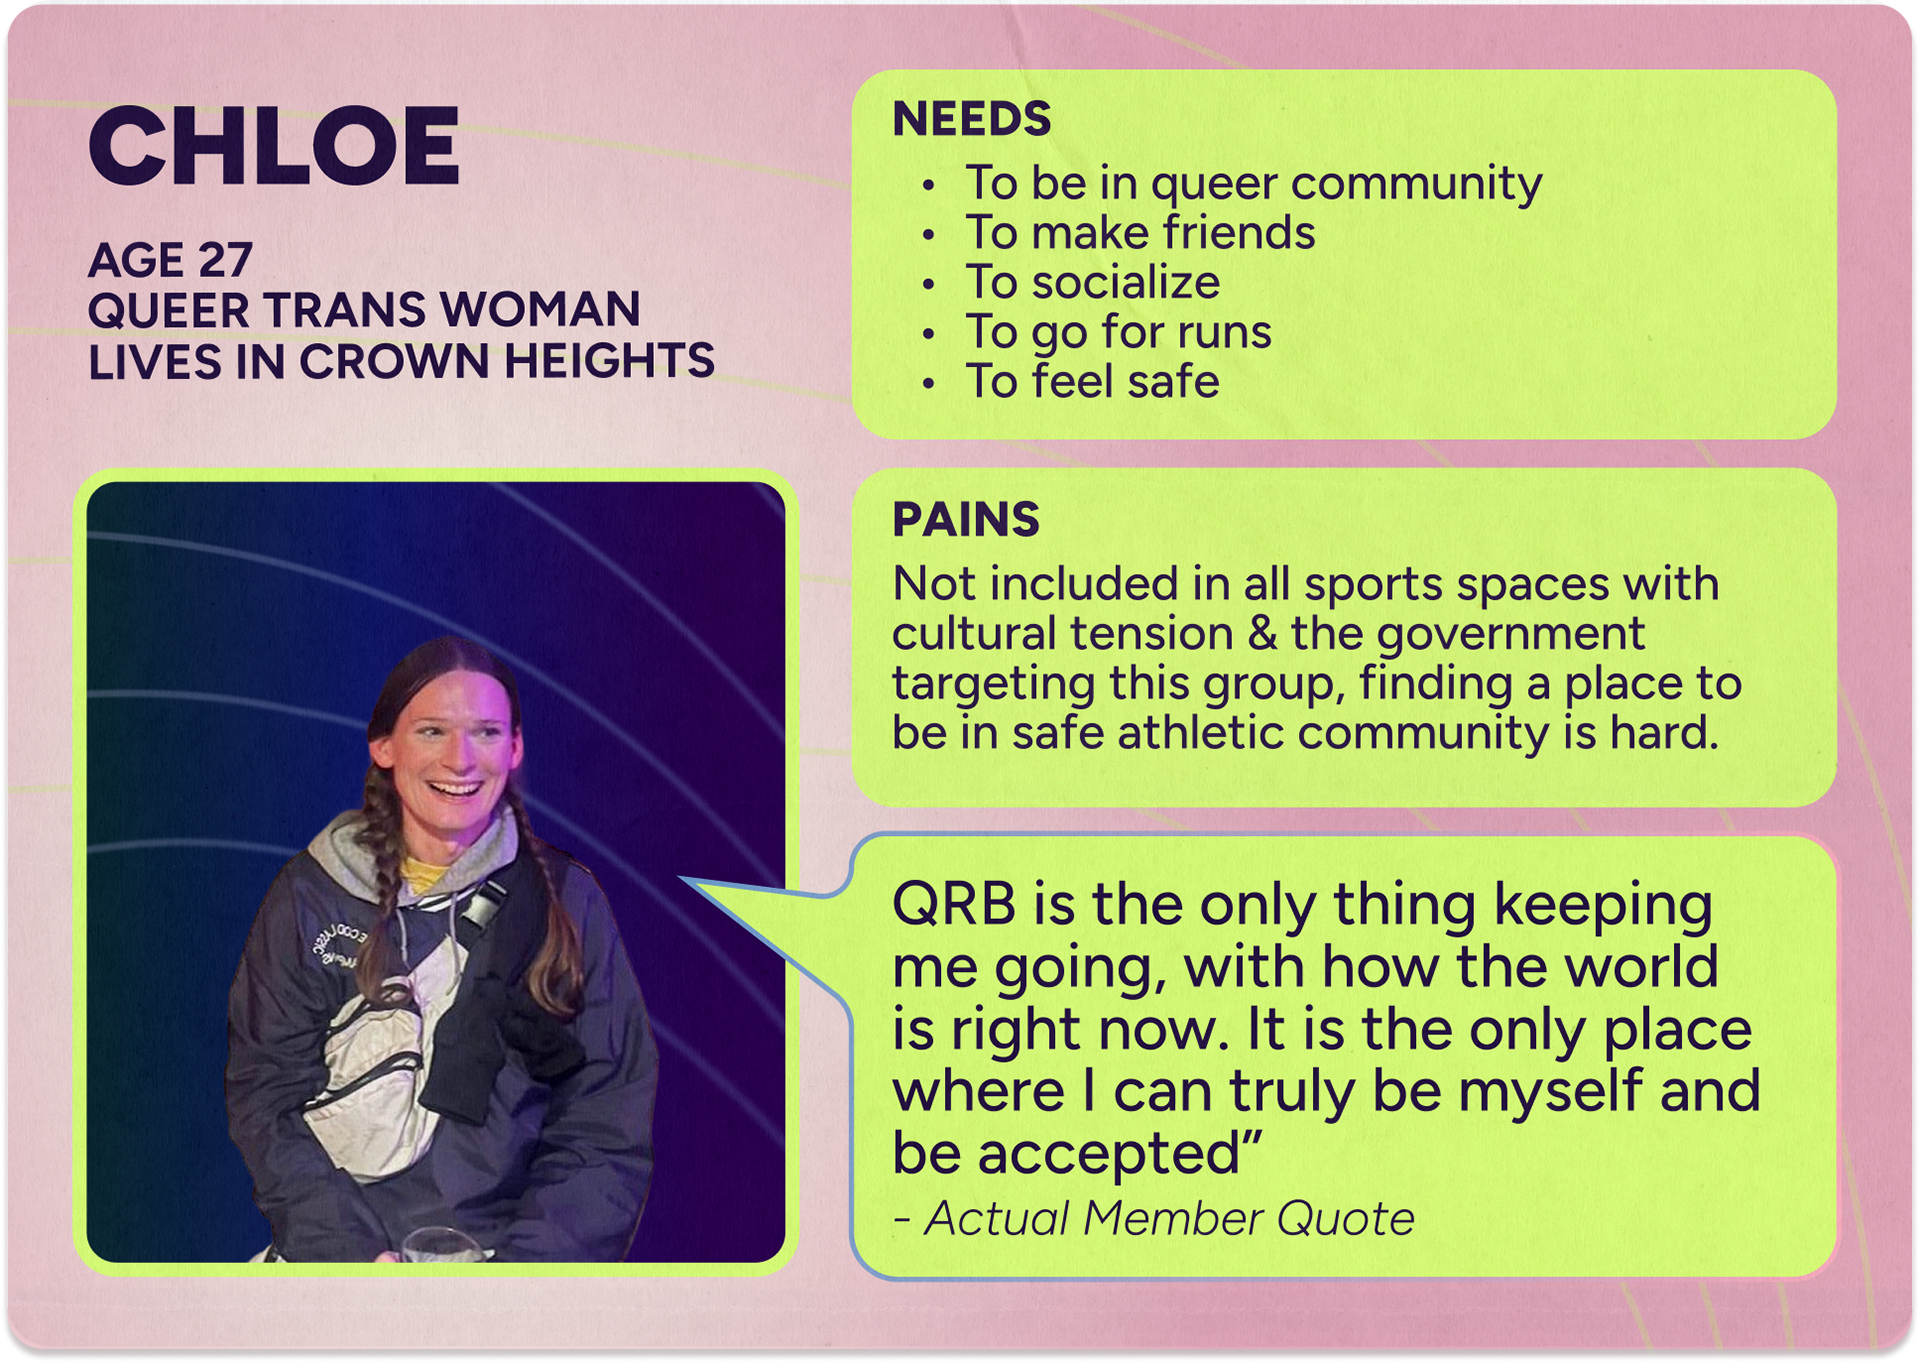
To better design for potential QRB's members, I created a persona based on the ideal member our club was designed to support.
.
.
Putting myself in Chloe's shoes, I saw the importance of prioritizing queer iconography for a felt sense of belonging.
Competitive Landscape
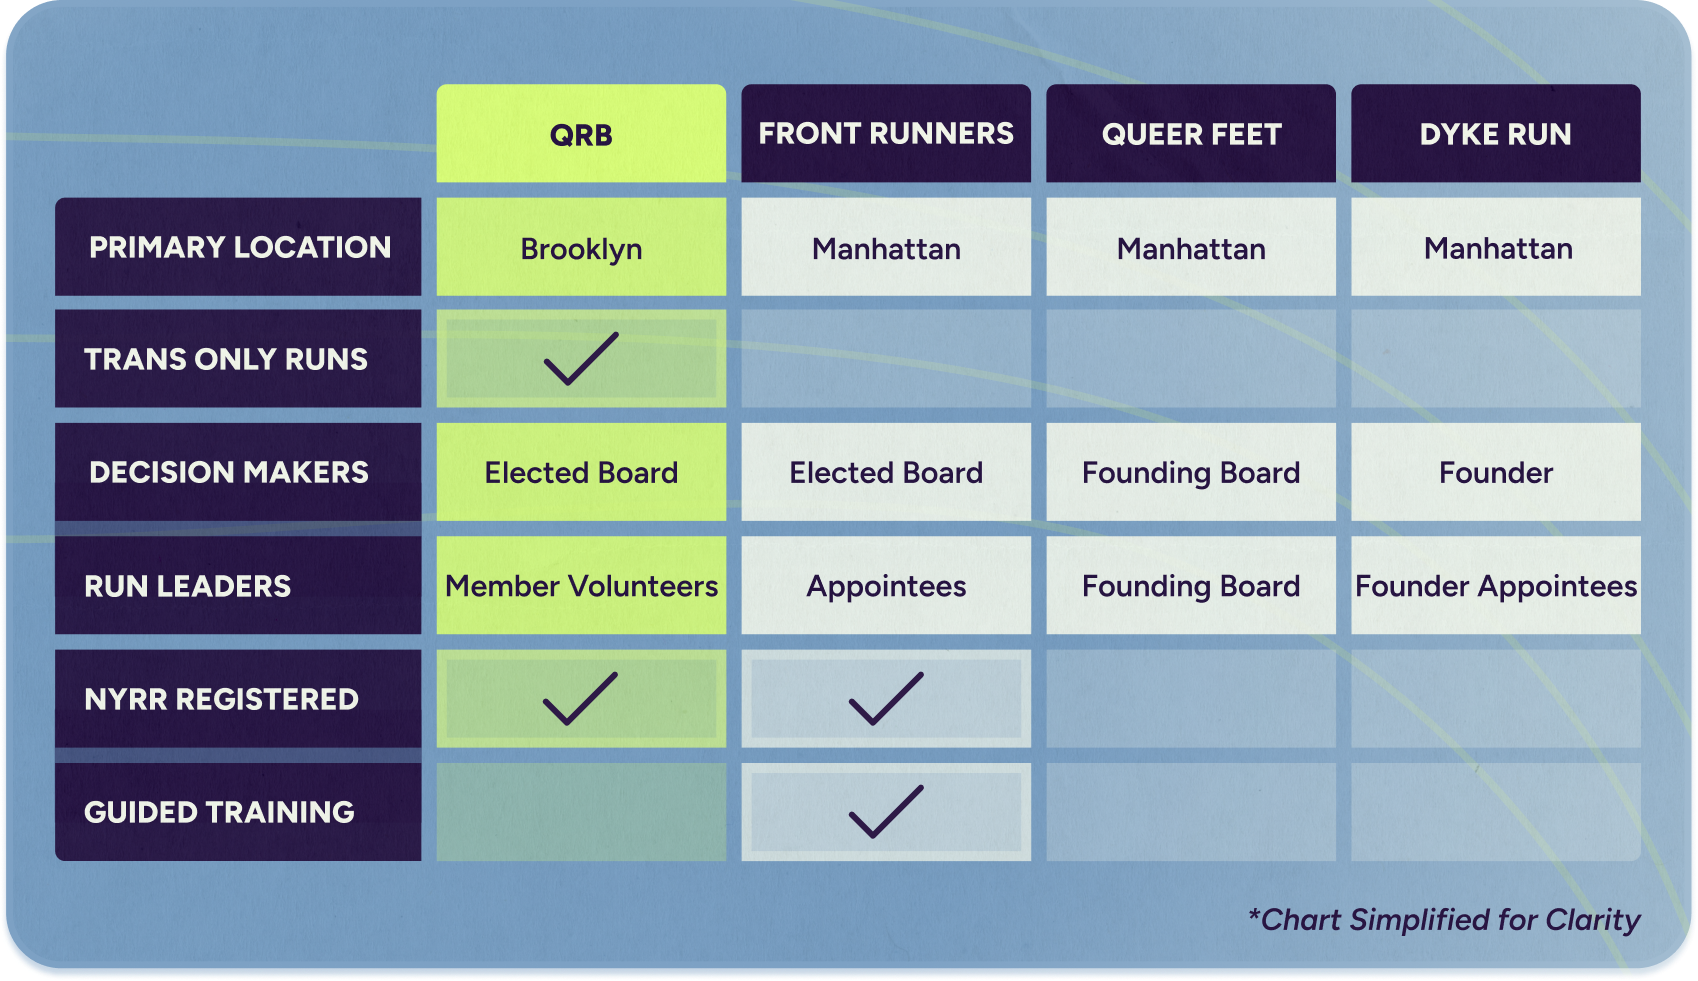
To understand what makes QRB distinct from the three other queer run clubs of NYC, I conducted competitive analysis across 20 different factors to gain a clear idea of the competitive landscape.
.
.
From this analysis I found three core differentiators in QRB's value proposition that needed to be reflected:
1. Highly Specific Community Served — QRB is the only Brooklyn based queer run club and the only NYC club with trans-exclusive runs. For these communities the base logistics of QRB are valuble.
2. Greater expectation of community investment — QRB is volunteer-lead. Necessitating a culture of greater community commitment than founder-driven run clubs. For those who want to feel like they are a contributing member of a community QRB yields value.
3. Unique Sporty-Social Balance — QRB is registered with NYRR but does not offer training plans, enabling competitive participation without structuring it as a core function thus supporting two levels of runner intensity.
3-Part Design Strategy
1. Signal belonging to target members by centering queer & Brooklyn based iconography with care to highlight the trans community specifically.
2. Reflect community leadership model with a friendly but not casual voice.
3. Reflect goals of target members by invoking a sporty energy without a clinical data-heavy performance aesthetics.
Reflecting the Community
With criteria established, I began building the brand system itself. To ensure these foundational decisions were truly representative I formed a design committee to build consensus and receive feedback efficiently.
TYPOGRAPHY
Process
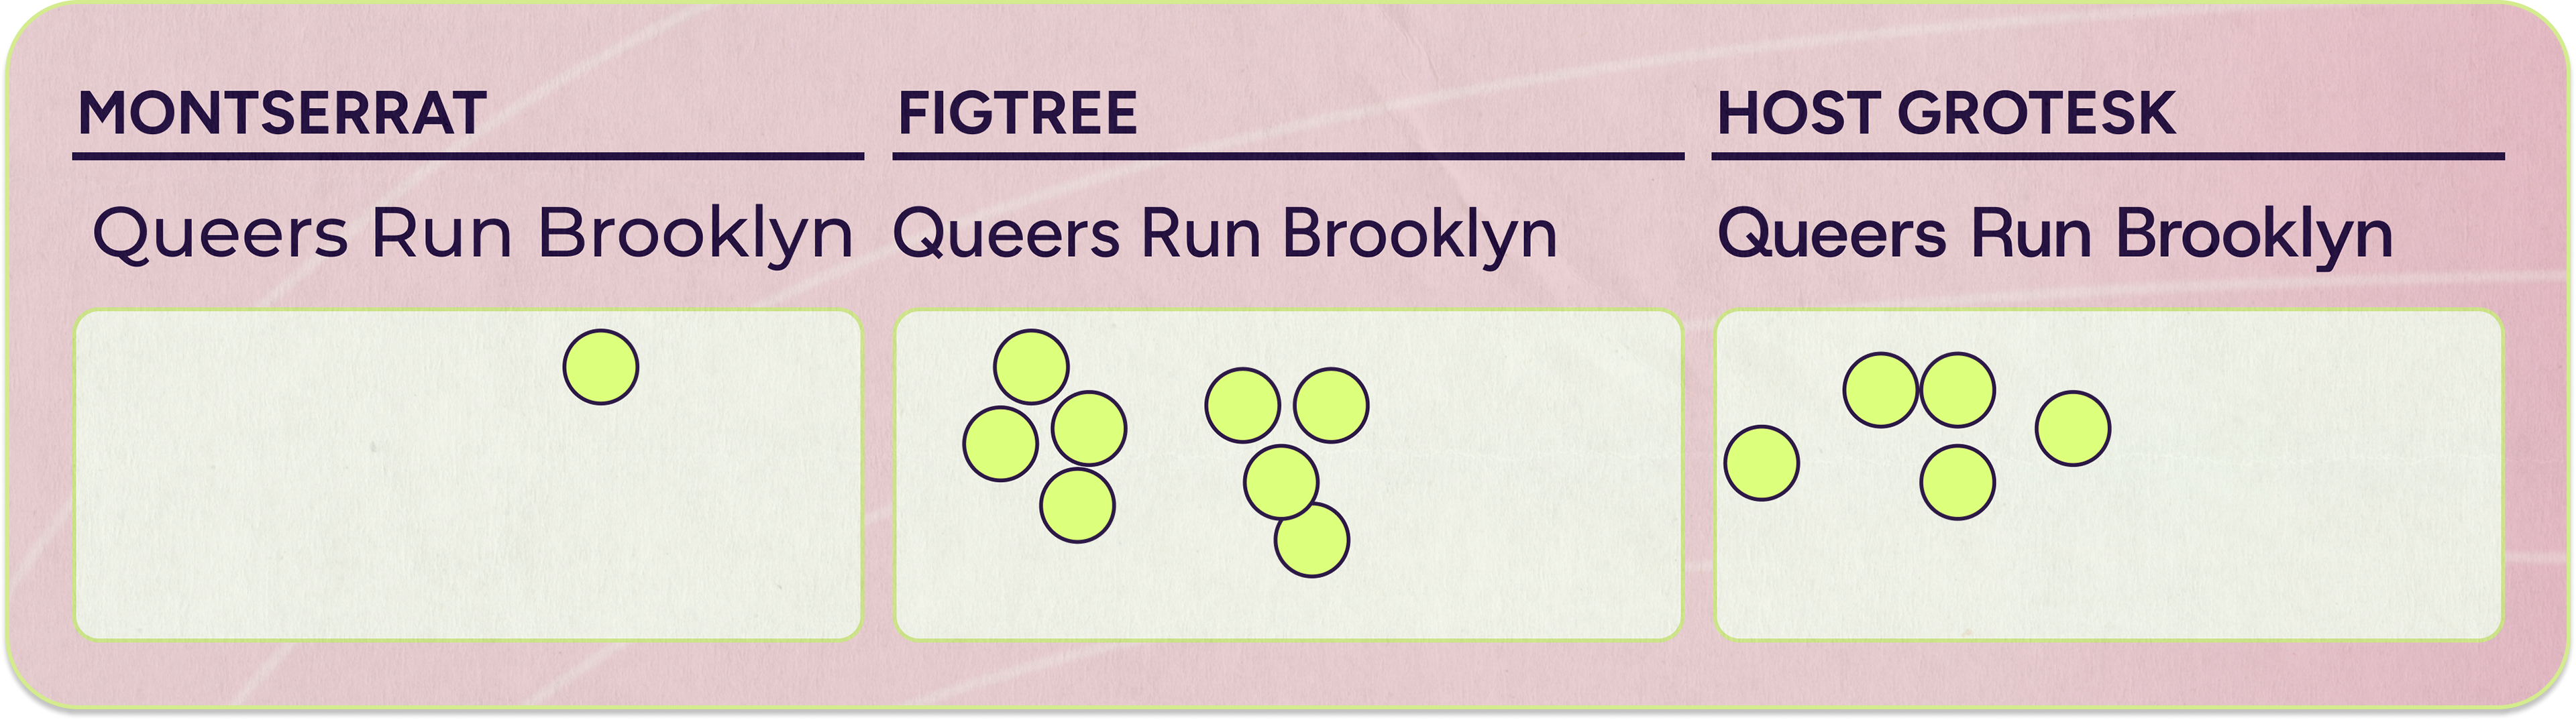
To determine our base font I sourced strategy aligned font options and polled the design committee.
.
.
Solution
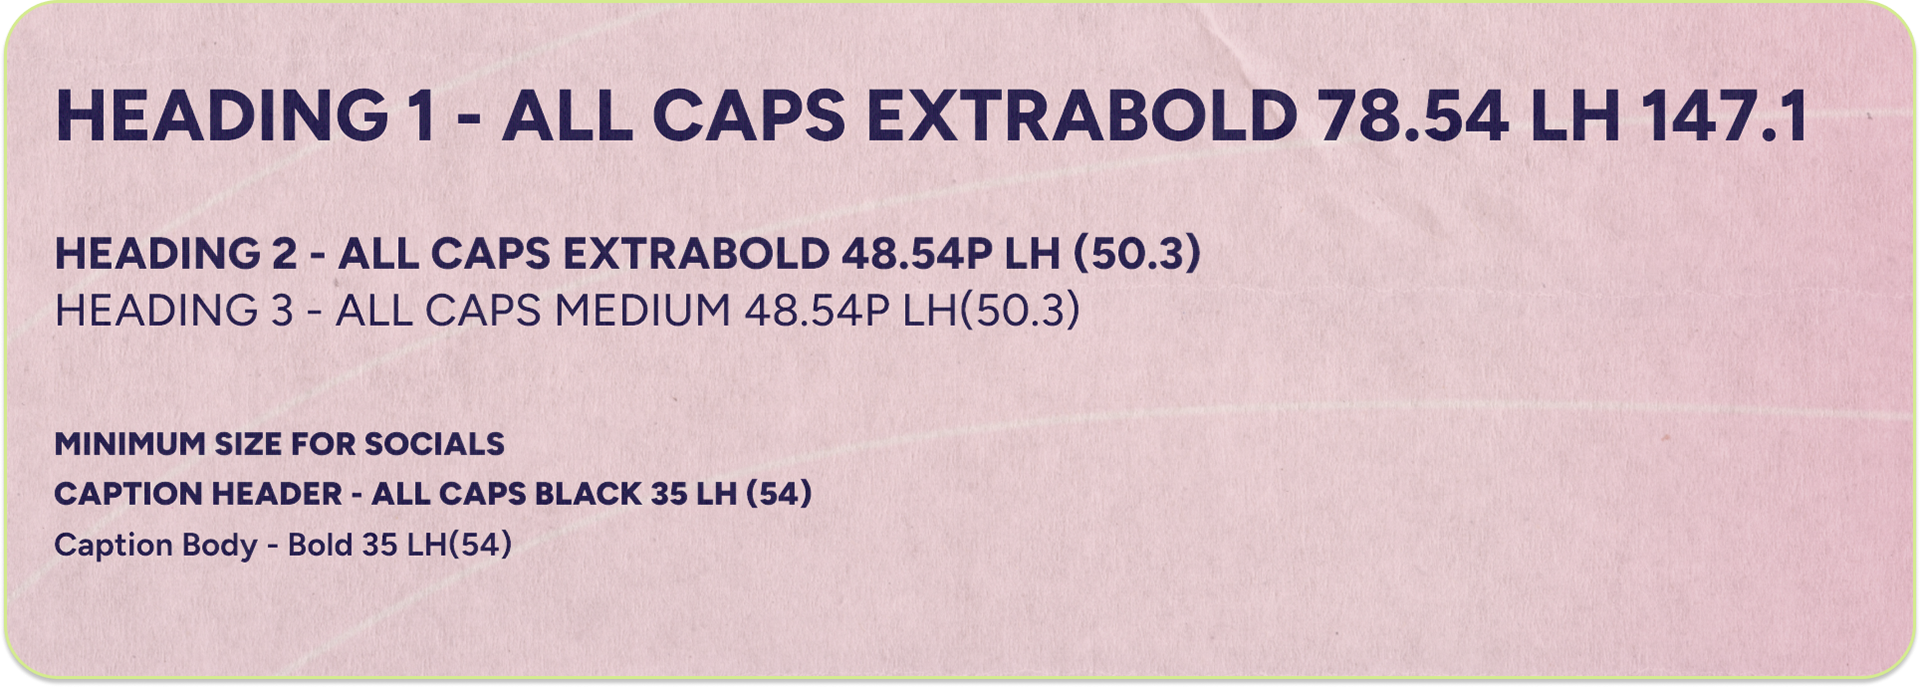
We decided on Figtree, its' weight and rounded nature of the font reflects QRB’s friendly voice, while its clean lines evoke a sporty energy and an air of commitment.
.
.
Logo
Process
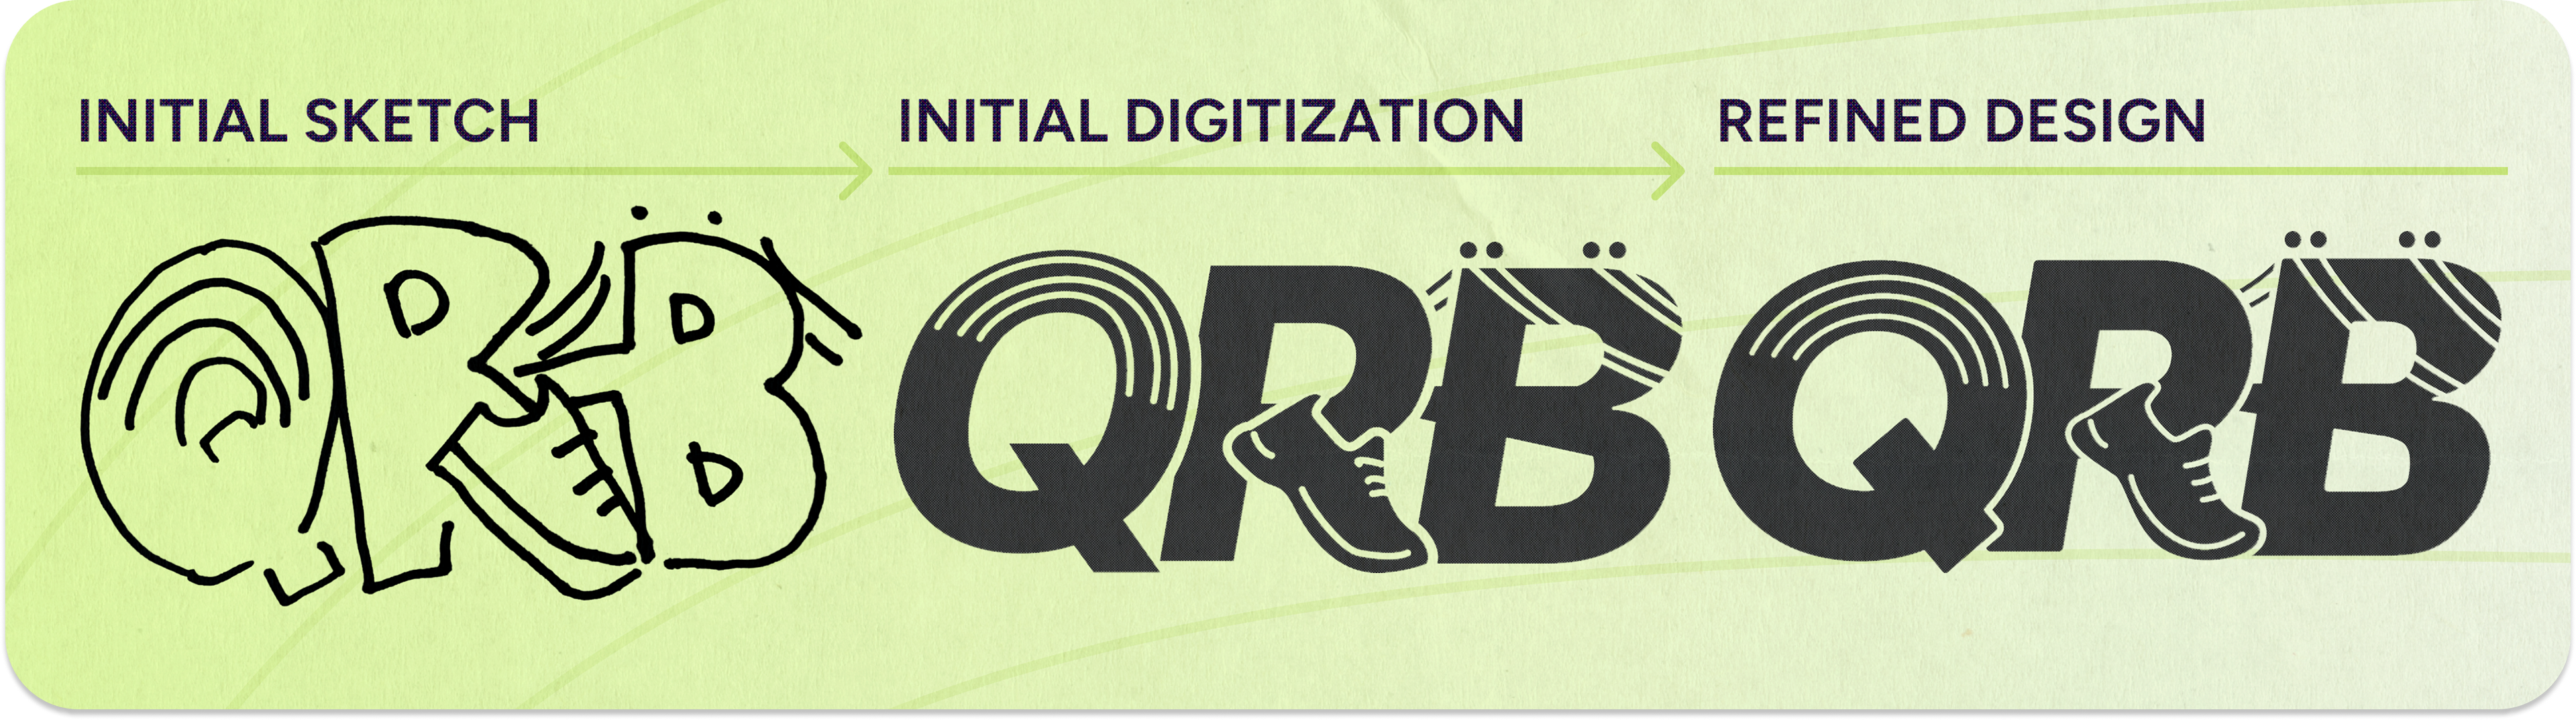
I sketched multiple options and brought the strongest designs into illustrator. I then showed these initial digitizations to the committee, who favored my most straightforward design as it clearly represented our value proposition.
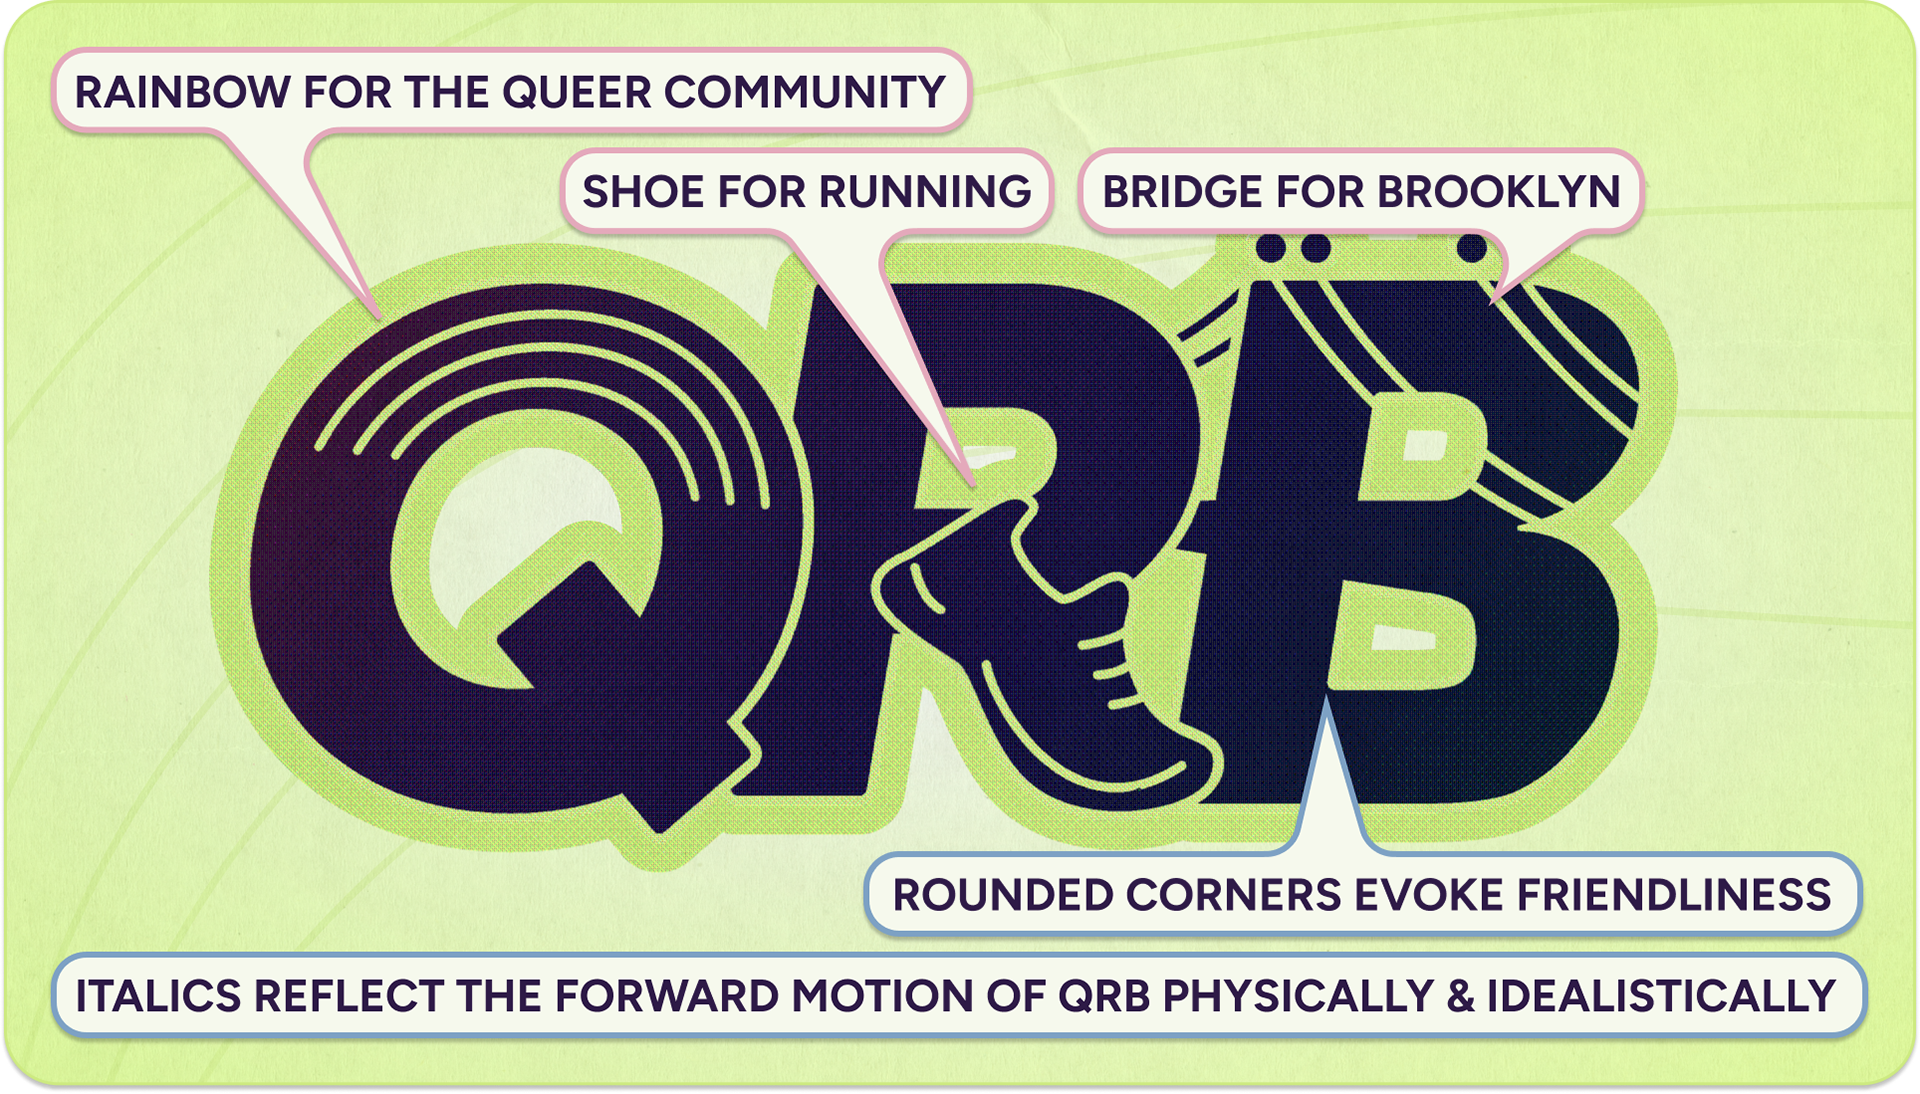
Finally I refined the design focusing on extending lines and repeating shapes.
.
.
Solution
.
.
Color Palette
Process
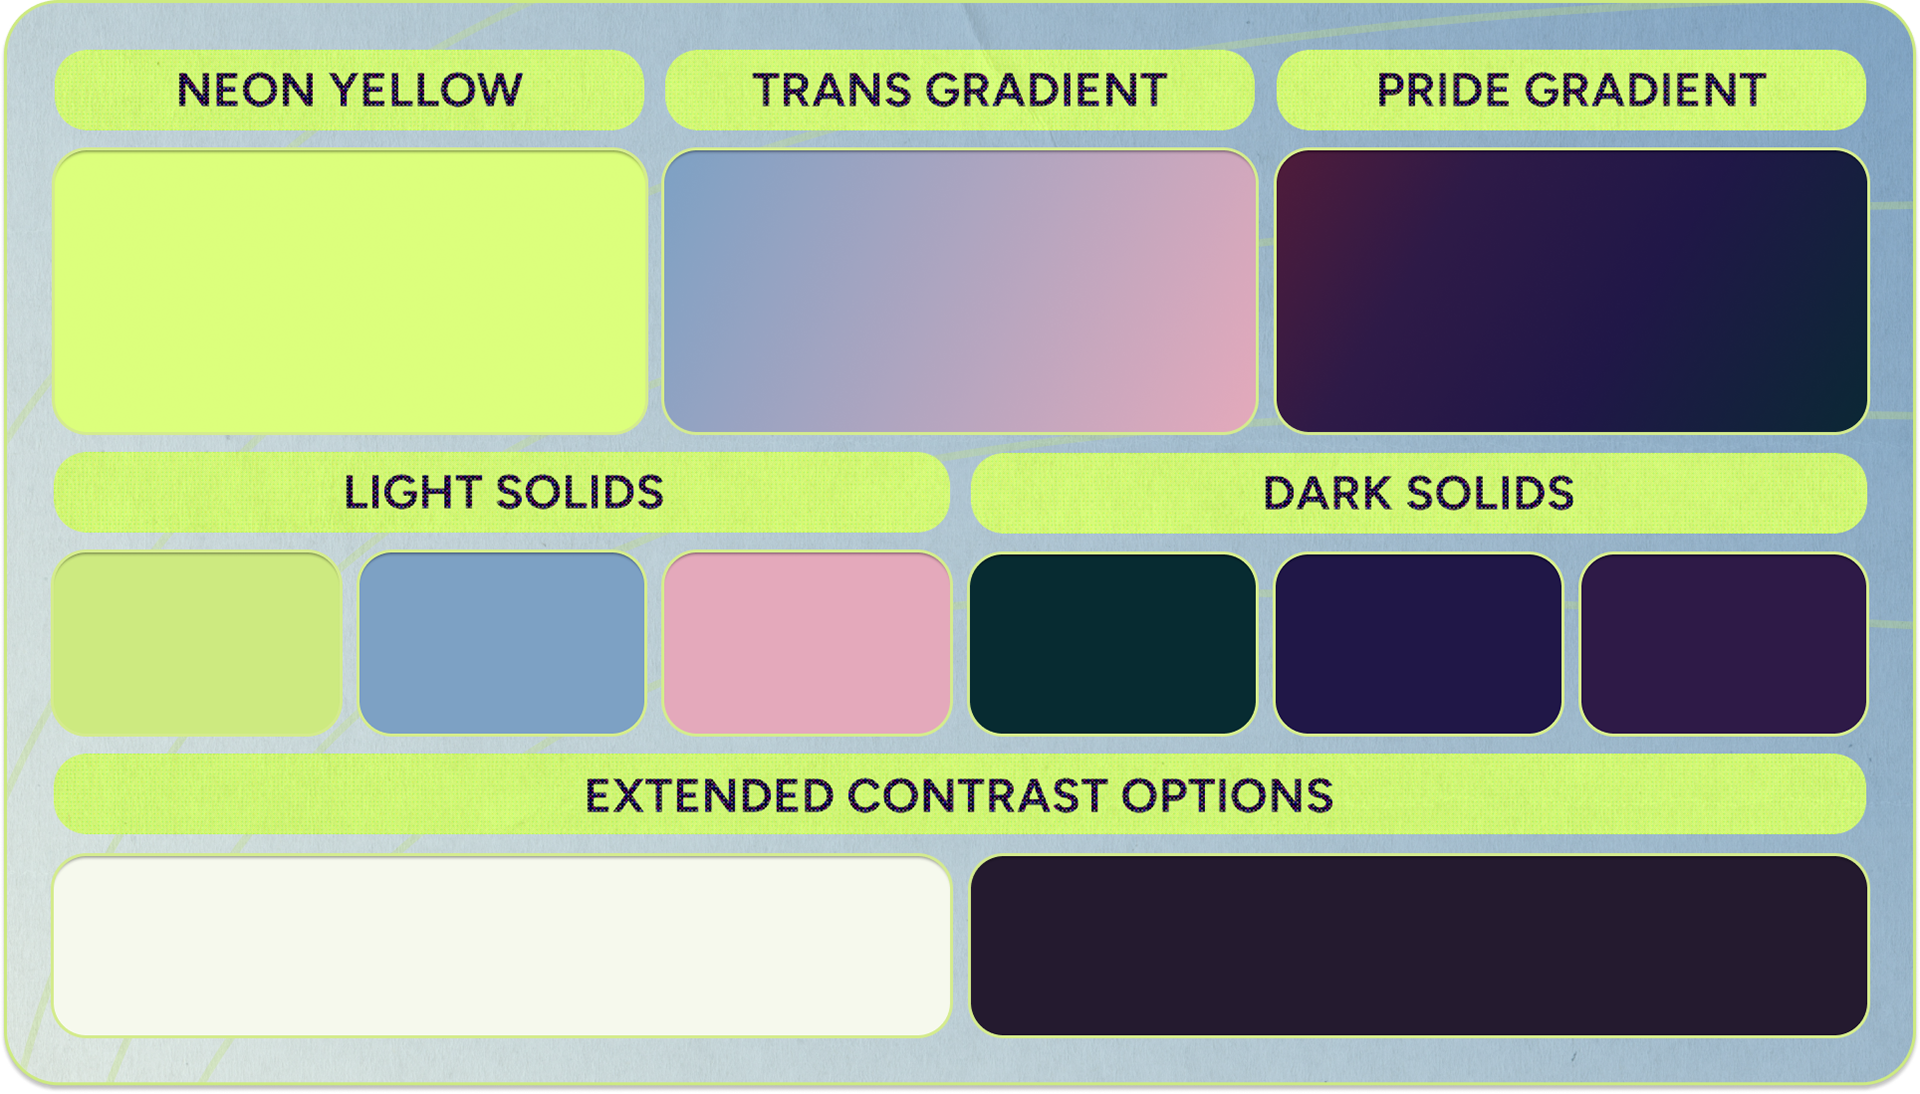
Given the guidelines, my first thought was to use the classic pride and trans flag colors to ensure our target demographic was represented.
However, as someone who went to a university whose color was tartan, a pattern (famously not the same thing as a color!), I knew it was important to me to have a consistent limited solid color palette option to fall back on when multicolor was not a manufacturing possibility to maintain consistency.
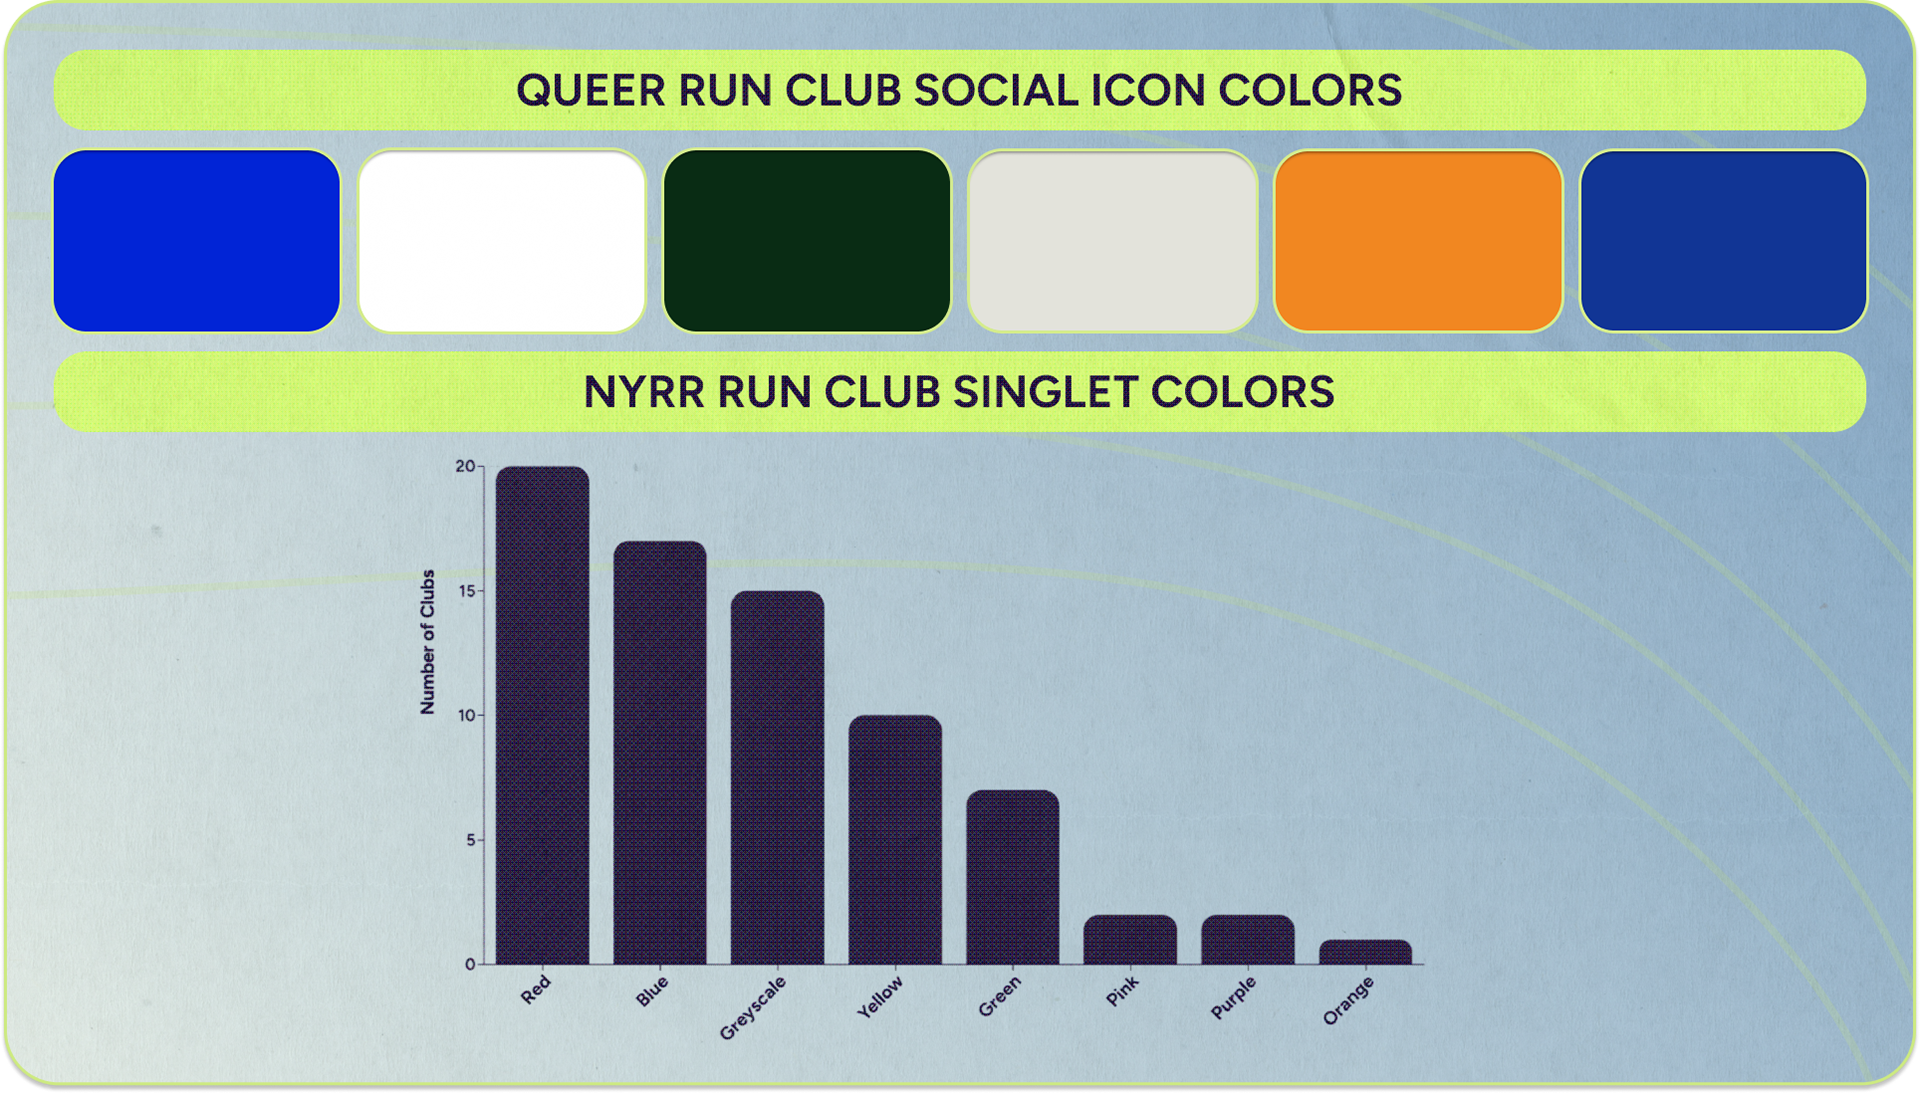
To decide what solid colors to choose I conducted a competitive analysis of the three other queer run clubs' social icons (QRB's community competitors), as well as 75 NYRR run club's (QRB's race competitors) singlets to ensure the color palette picked would differentiate our club from others online and during races.
.
.
The vast majority of clubs use red, blue, or greyscale as their primary singlet color.
Knowing this, I chose neon yellow as our highlight color to work along side our trans and pride gradients as yellow is different from other queer clubs generally underrepresented in NYRR, associated with energy and sports, helpful for visibility, and contrasting in the purple effect of the other stylized rainbow gradients used to represent the club.
Solution
.
.
Additional Elements
Curved Lines
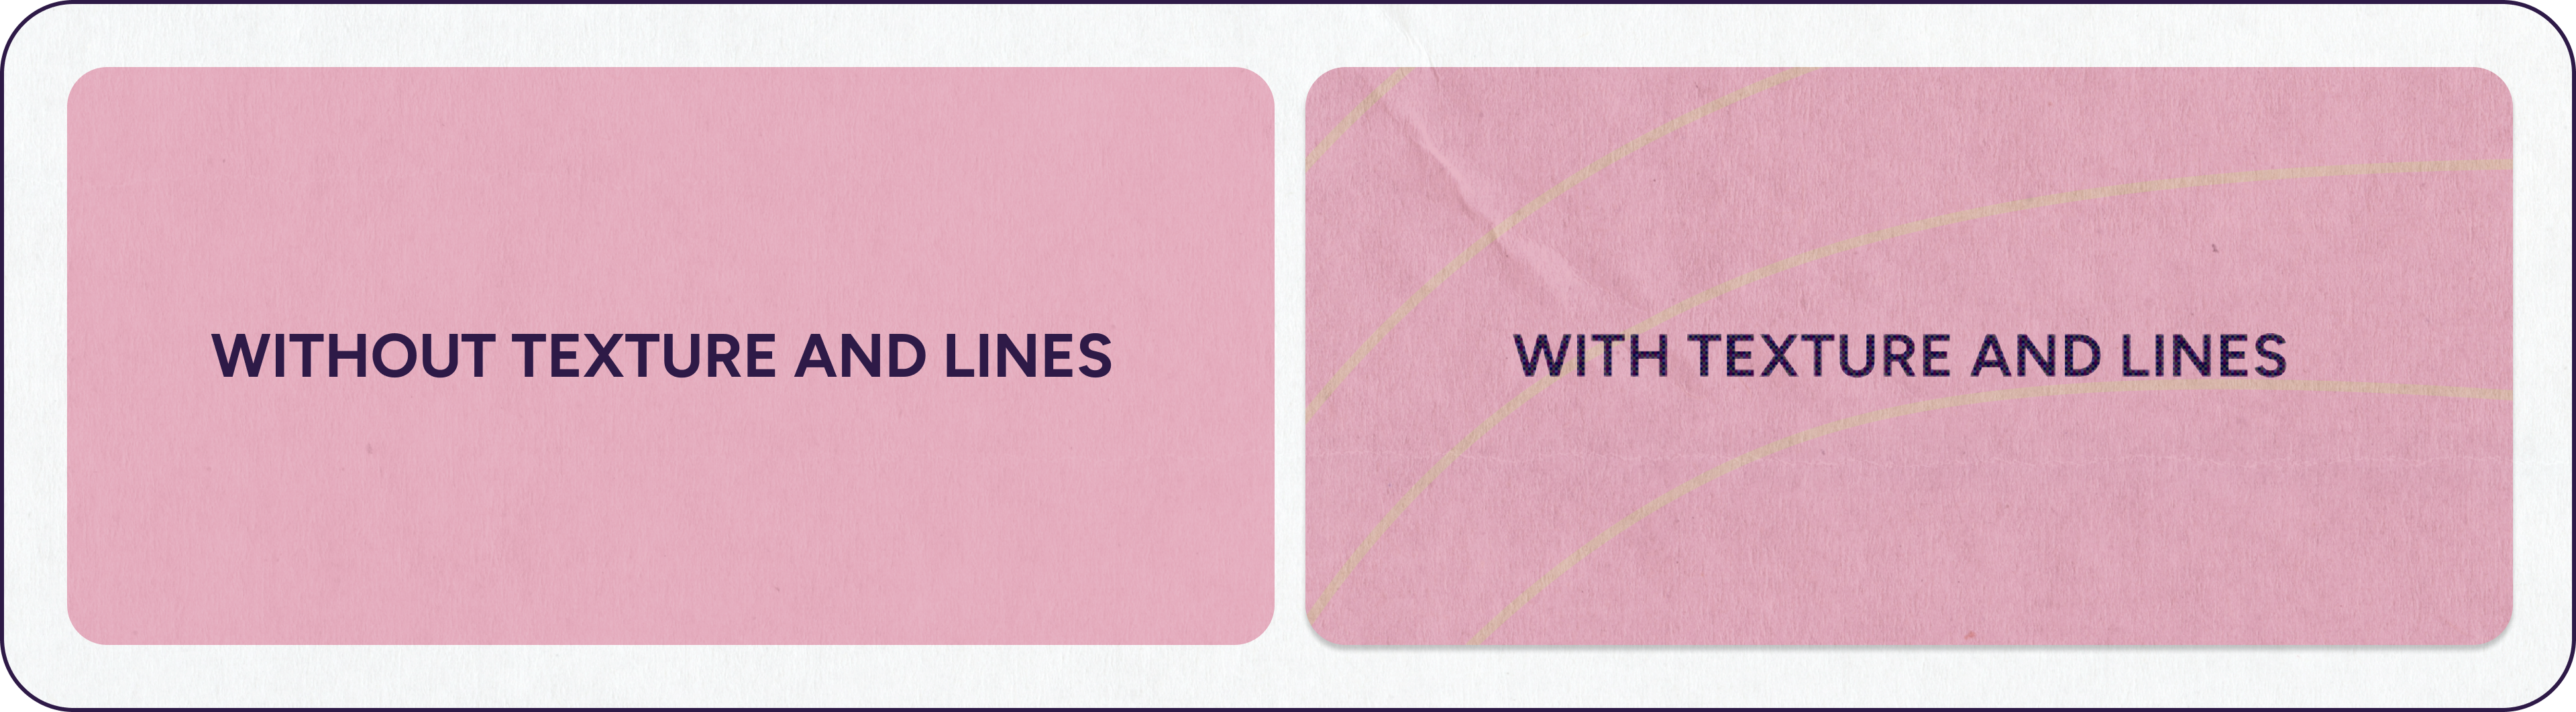
Stacked curved lines represent the layers of the pride flag and the lines of a track, they are used in the background of designs to add texture and structure.
Real world elements and textures
I added real world textures in all non physical designs (3D designs have inherent texture) to add visual interest and add a warmth to the sporty gradients.
.
.
selection of Final Designs
Social Icons
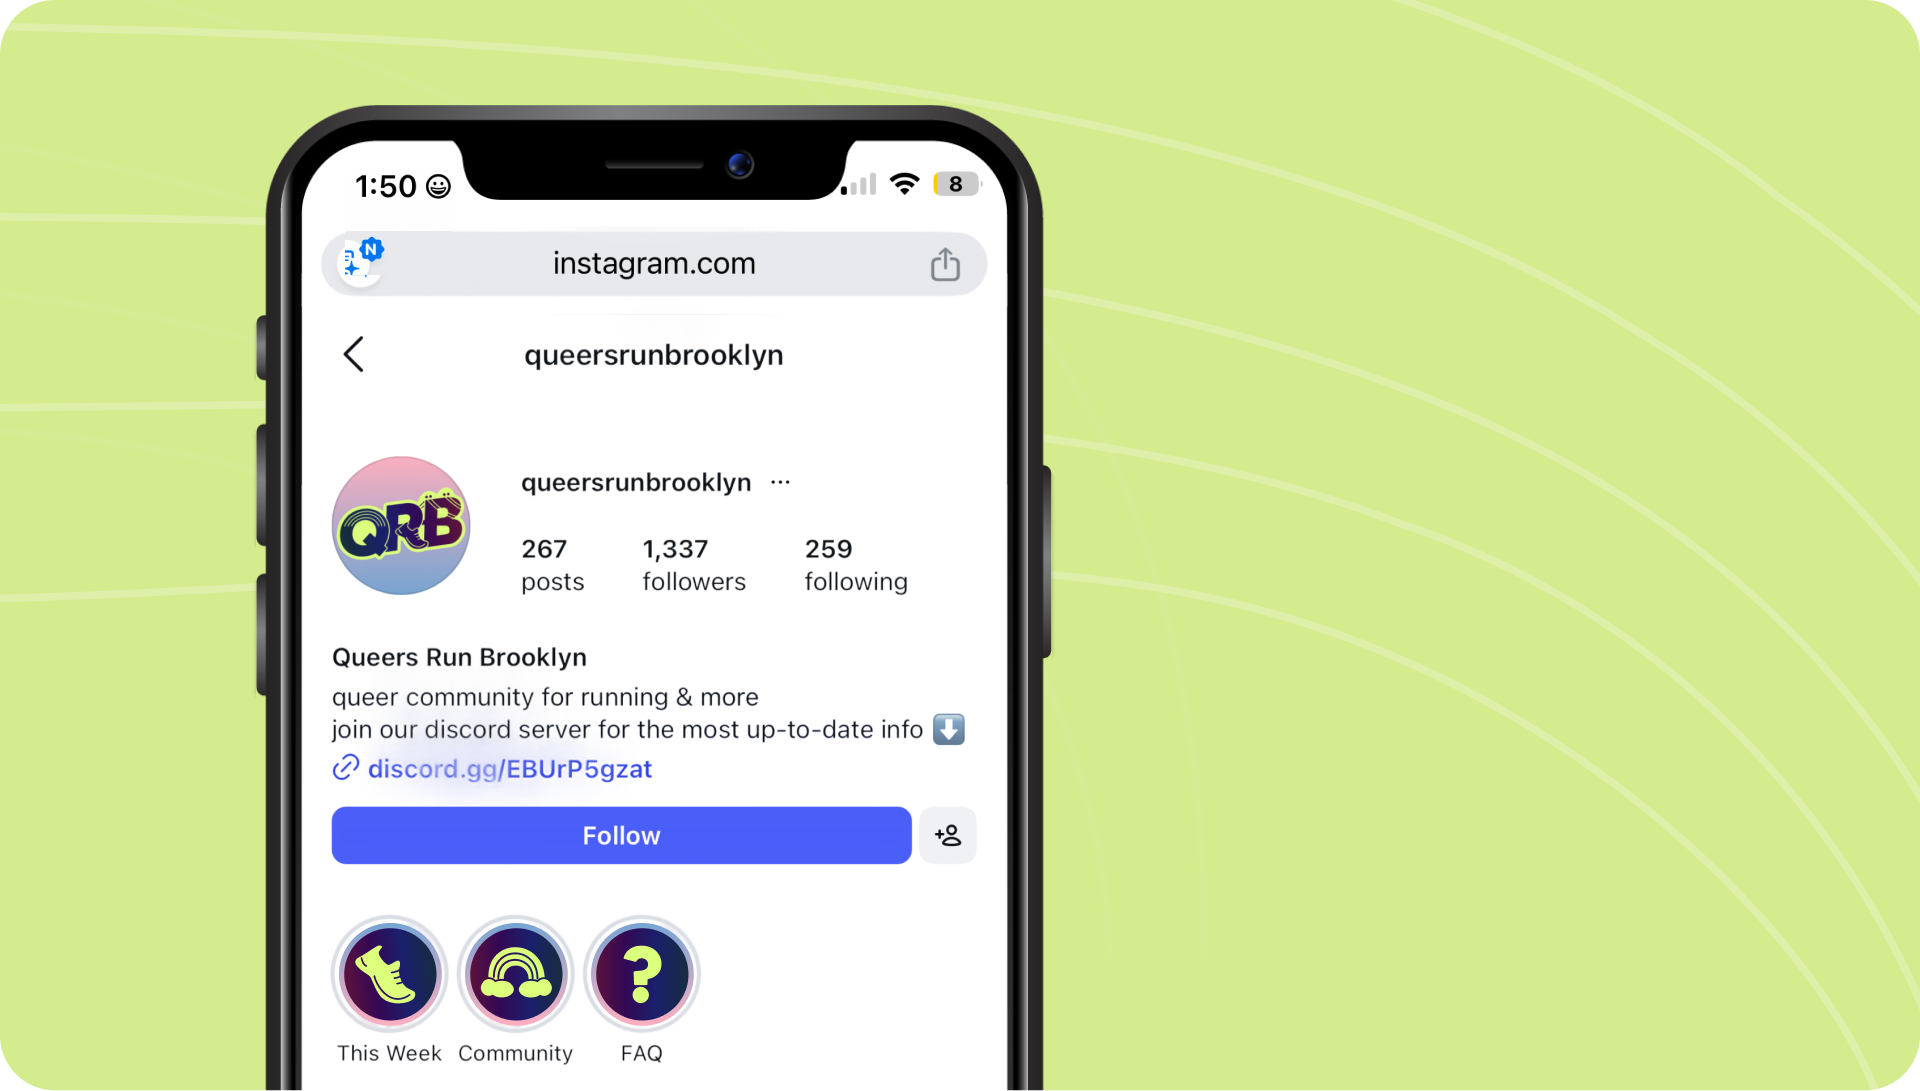
The gradient backgrounds of the profile photo and story covers connect, creating a seamless visual flow of the whole profile page.
.
.
Clothing
Singlet
This design fixes a common singlet design error that has bugged me since I started racing in middle school - low logo placement! Most singlets feature a logo centered on the chest, but race bibs are sized for a 5'10" person, so most people end up covering their club/team logo with the race bib.
To solve this problem, I placed the QRB mark in the upper corner above where a bib sits. Ensuring the club logo is visible on all racers' singlets.
.
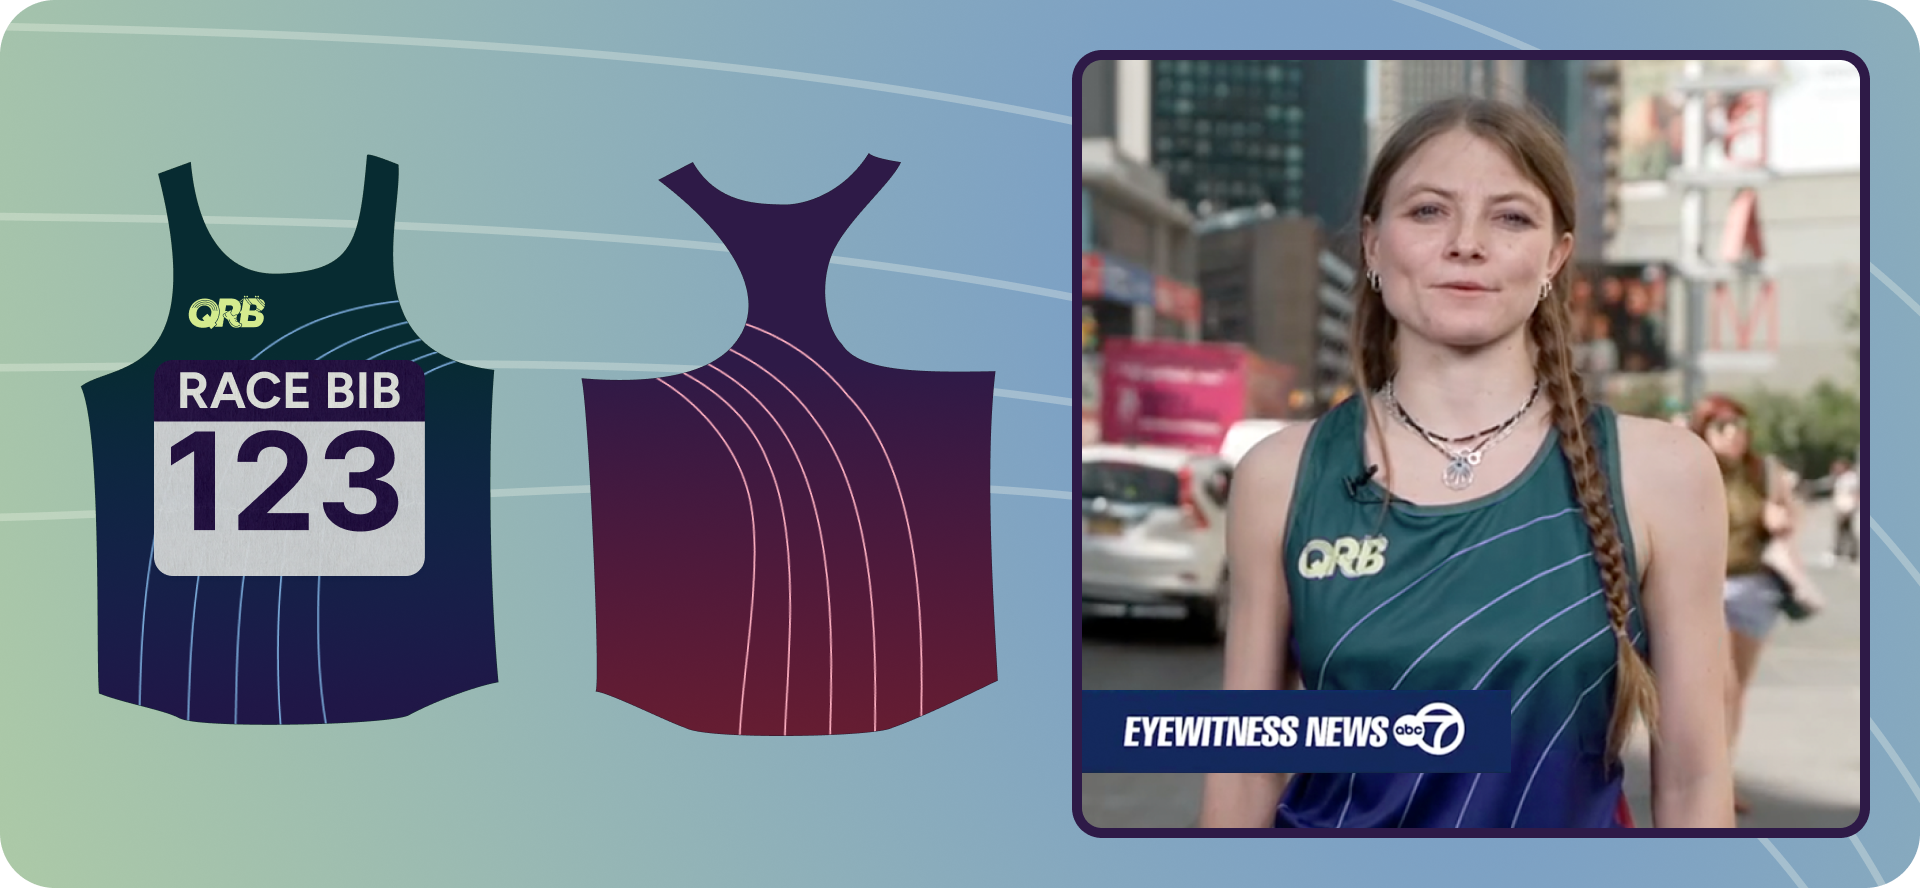
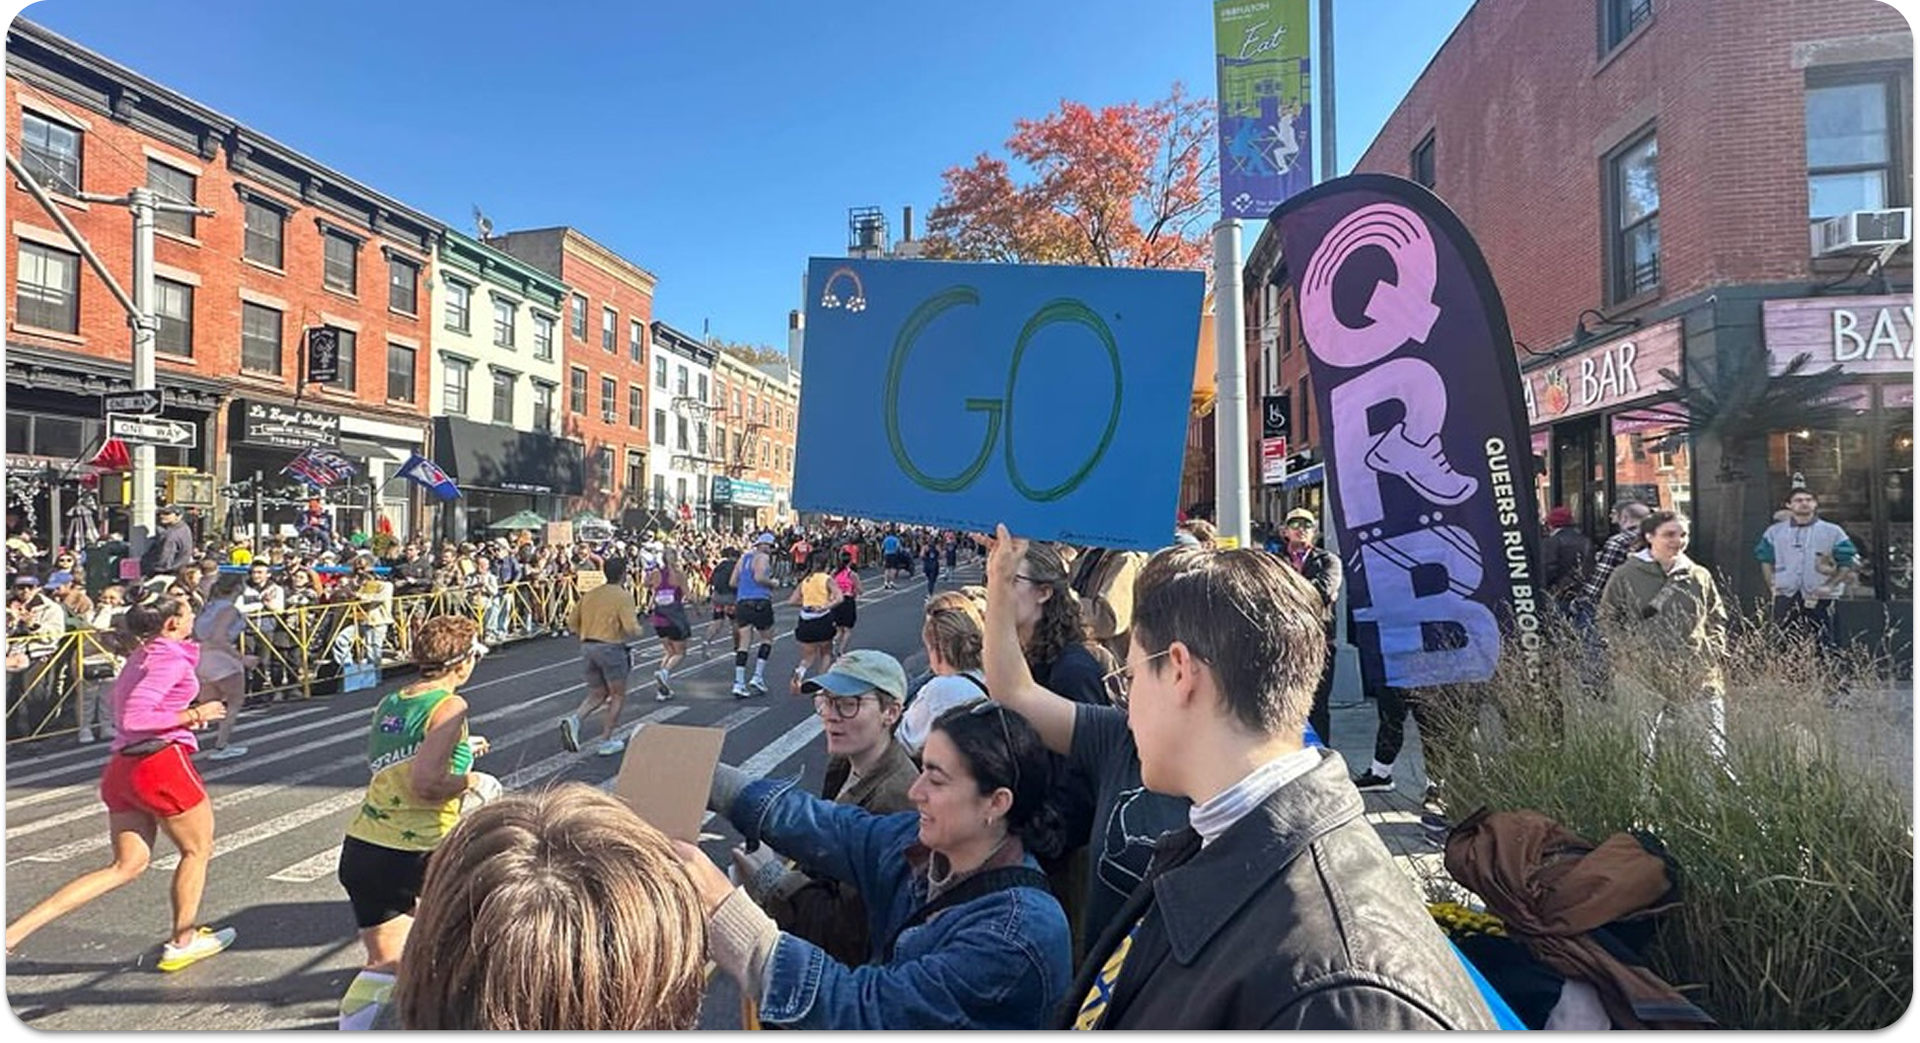
The singlets were also in a news segment on the NYC marathon featuring our club
.
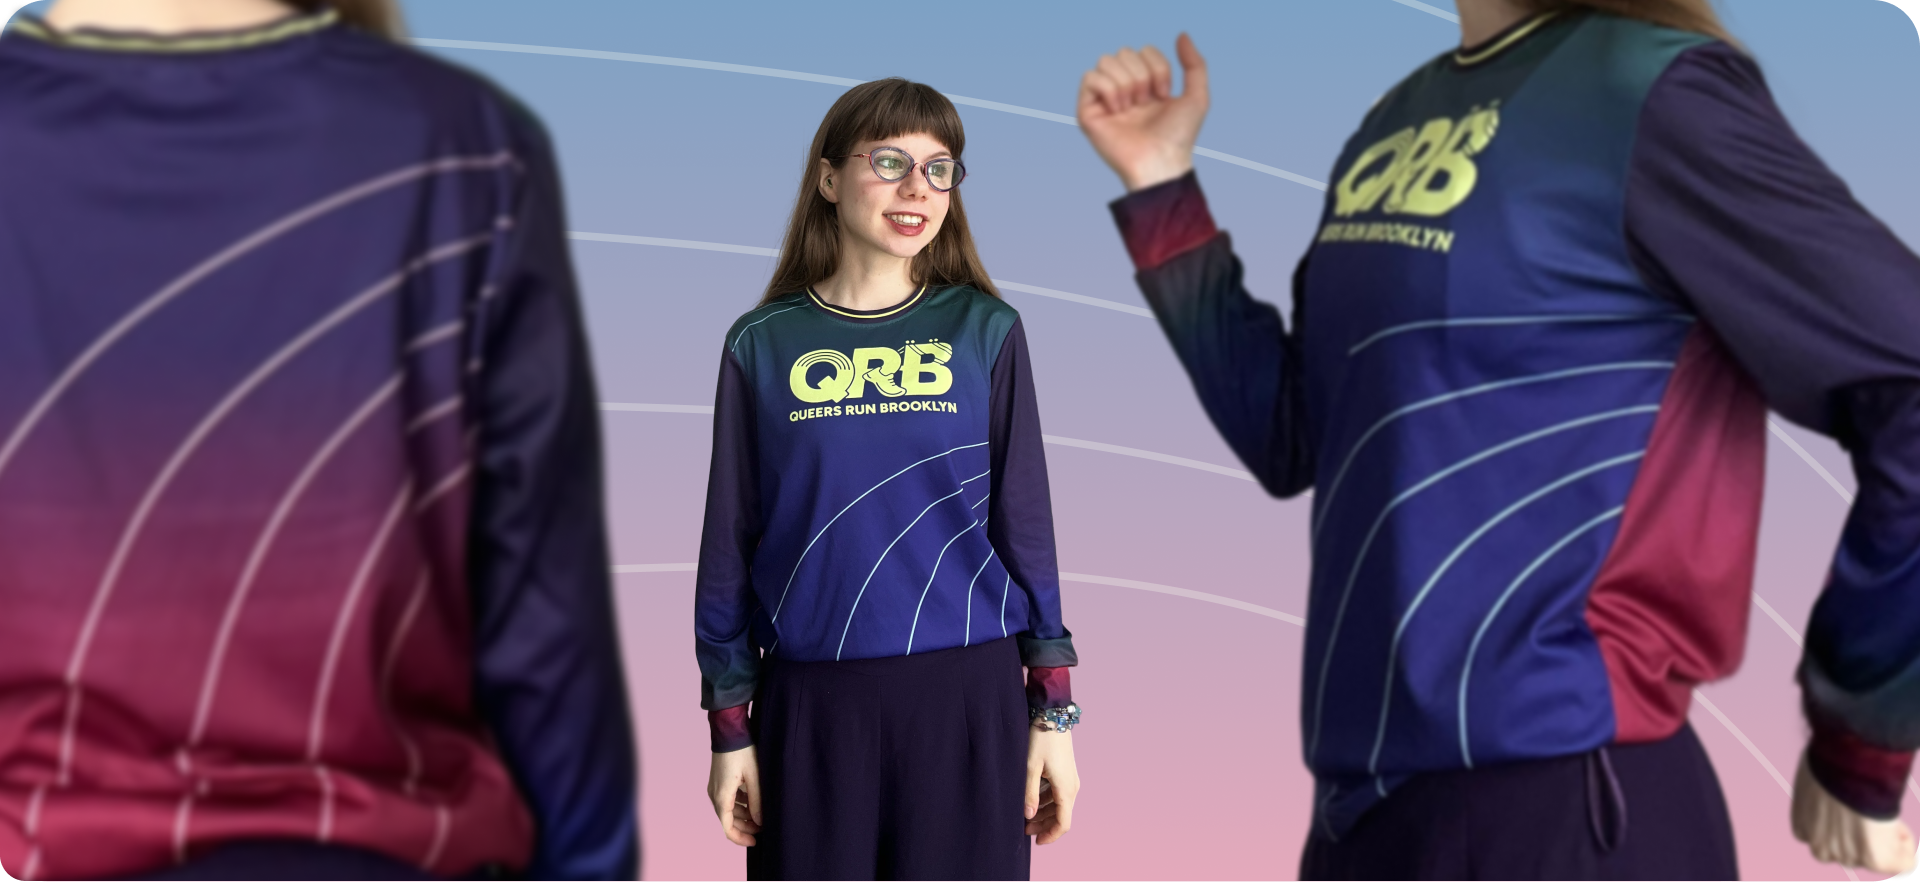
LONG SLEEVE
Inspired by 90s Costa Barcelona this design geometric was tested to ensure elements were flattering for a full range of sizes, cuts, and gender expressions.
.
.
Event Posts
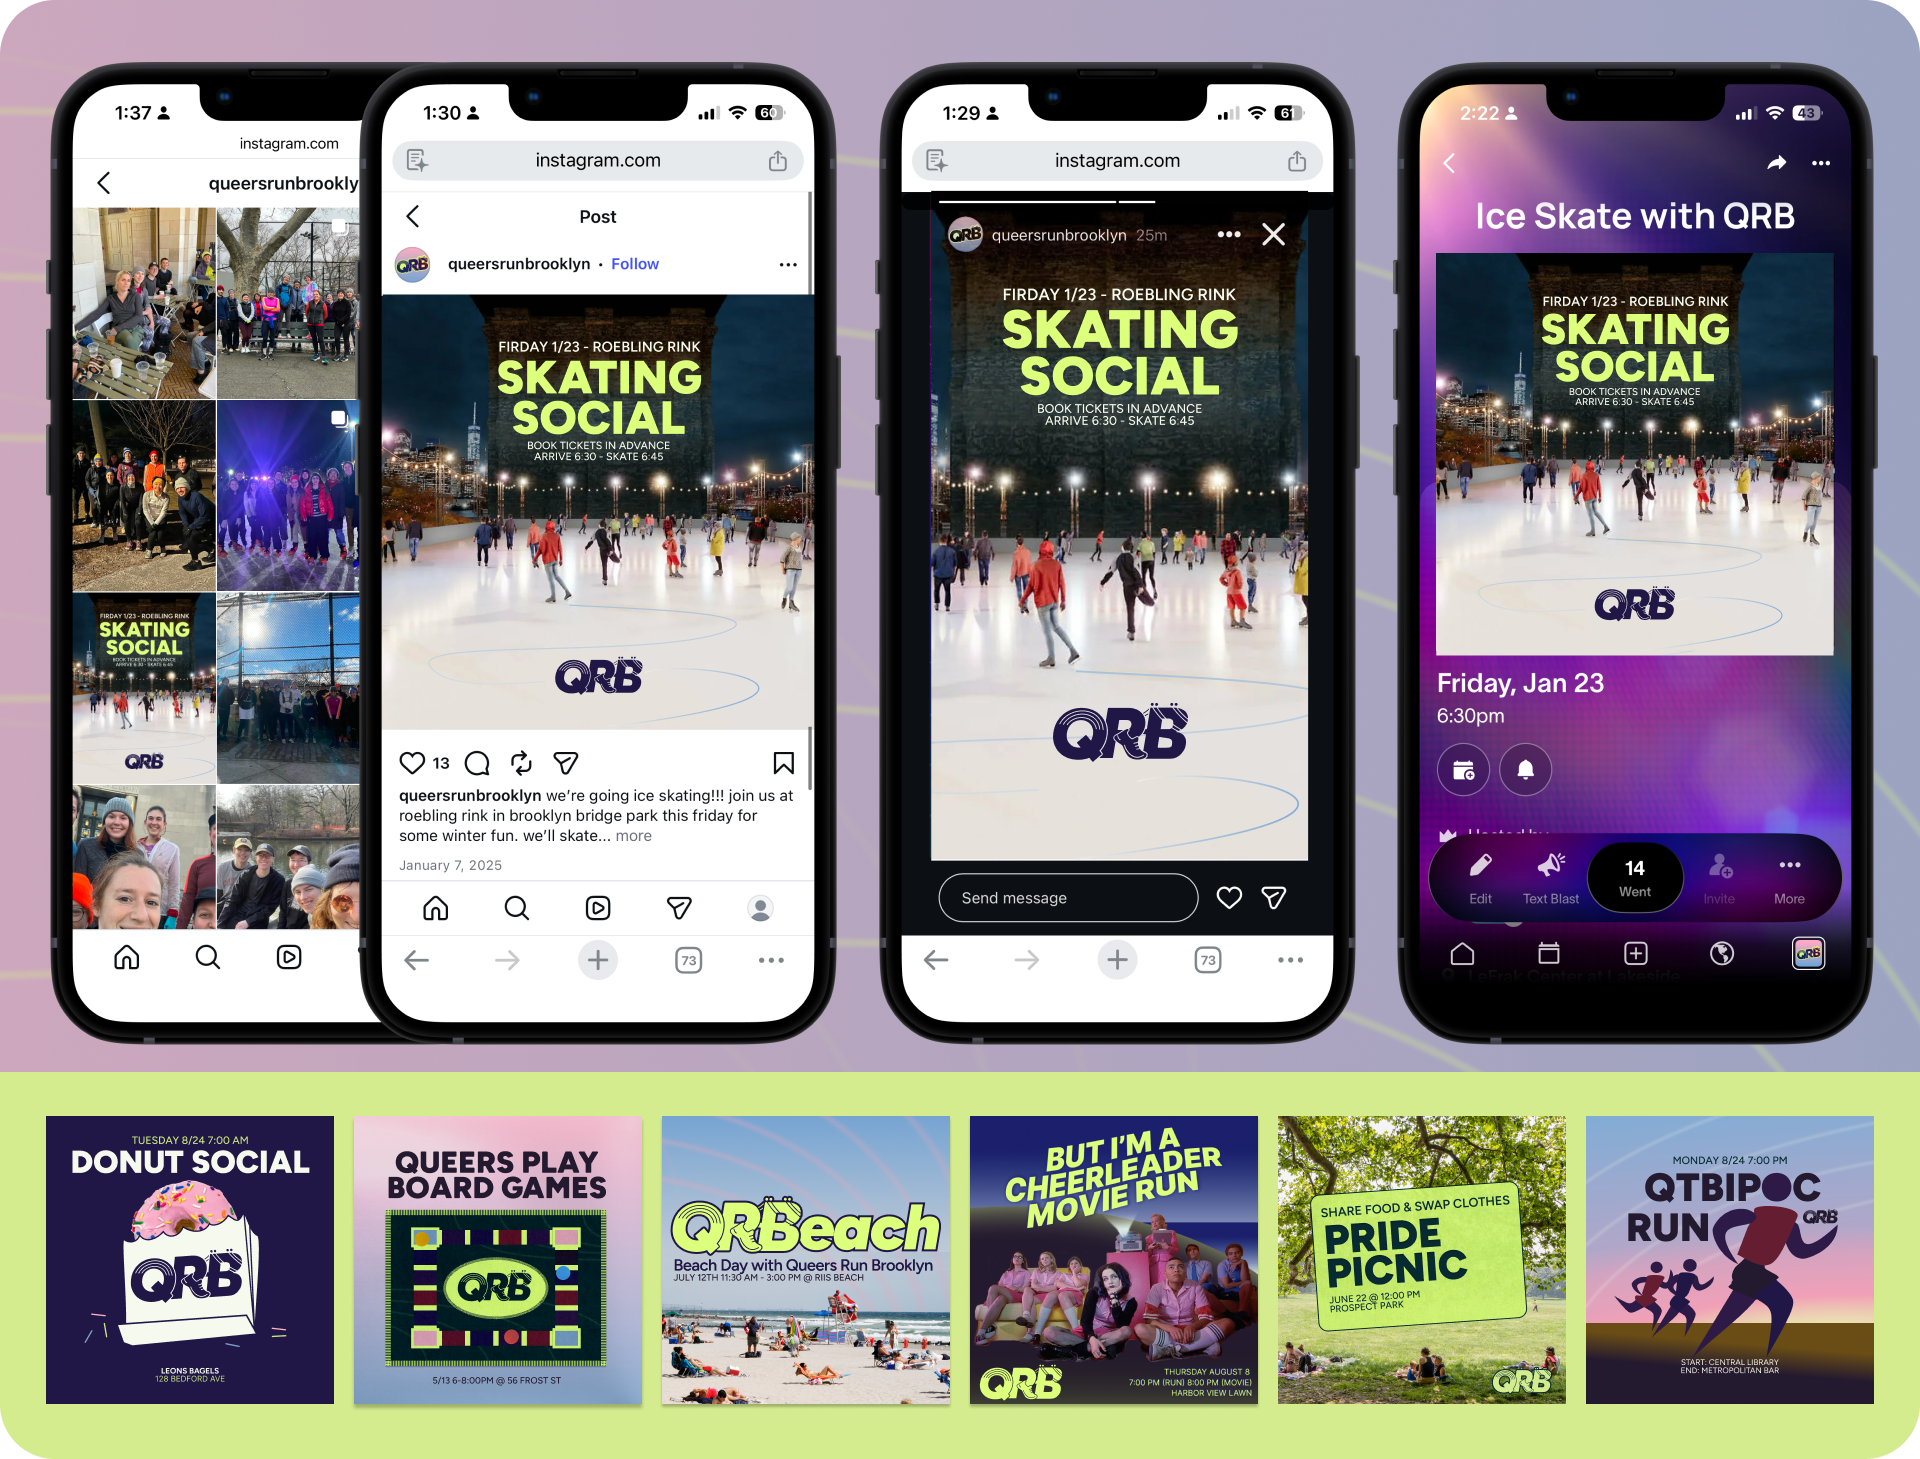
QRB hosts monthly social events (beach days, camping trips, skating nights, game nights etc.)., for each I created marketing materials in three formats: Instagram feed post, Instagram story, and Partiful cover.
To ensure successful multi-format design I established core layout for the story post format, with the dimensions of the instagram feed and story post dimensions locked in a visible top layer to ensure I did not get tied to unscalable elements.
.
Challenge 2/2
Communicate
How might we build the infrastructure necessary to ensure that the QRB community runs together?
-
Discover
Building understanding
User Needs
To identify what information I would need to communicate I led think-aloud interviews with members, asking them to describe how they would figure out whether to go to a run, and how they would get there.
This produced a frequency-ranked list of what variables members actually needed to know to get to a run (for variables with the same % of mentions I prioritized primacy of mention):
1. Day and time of run — mentioned by 100% of members
2. Start location — mentioned by 100% of members
3. End location — mentioned by 60% of members
4. Run distance — mentioned by 50% of members
5. Run route — mentioned by 30% of members
To validate and confirm the ordering of this list, I followed the think-aloud interviews with a card sorting activity. Members sorted possible pieces of run information into four categories (forced choice formatting): Need, Want, Fine, and Unhelpful.
.
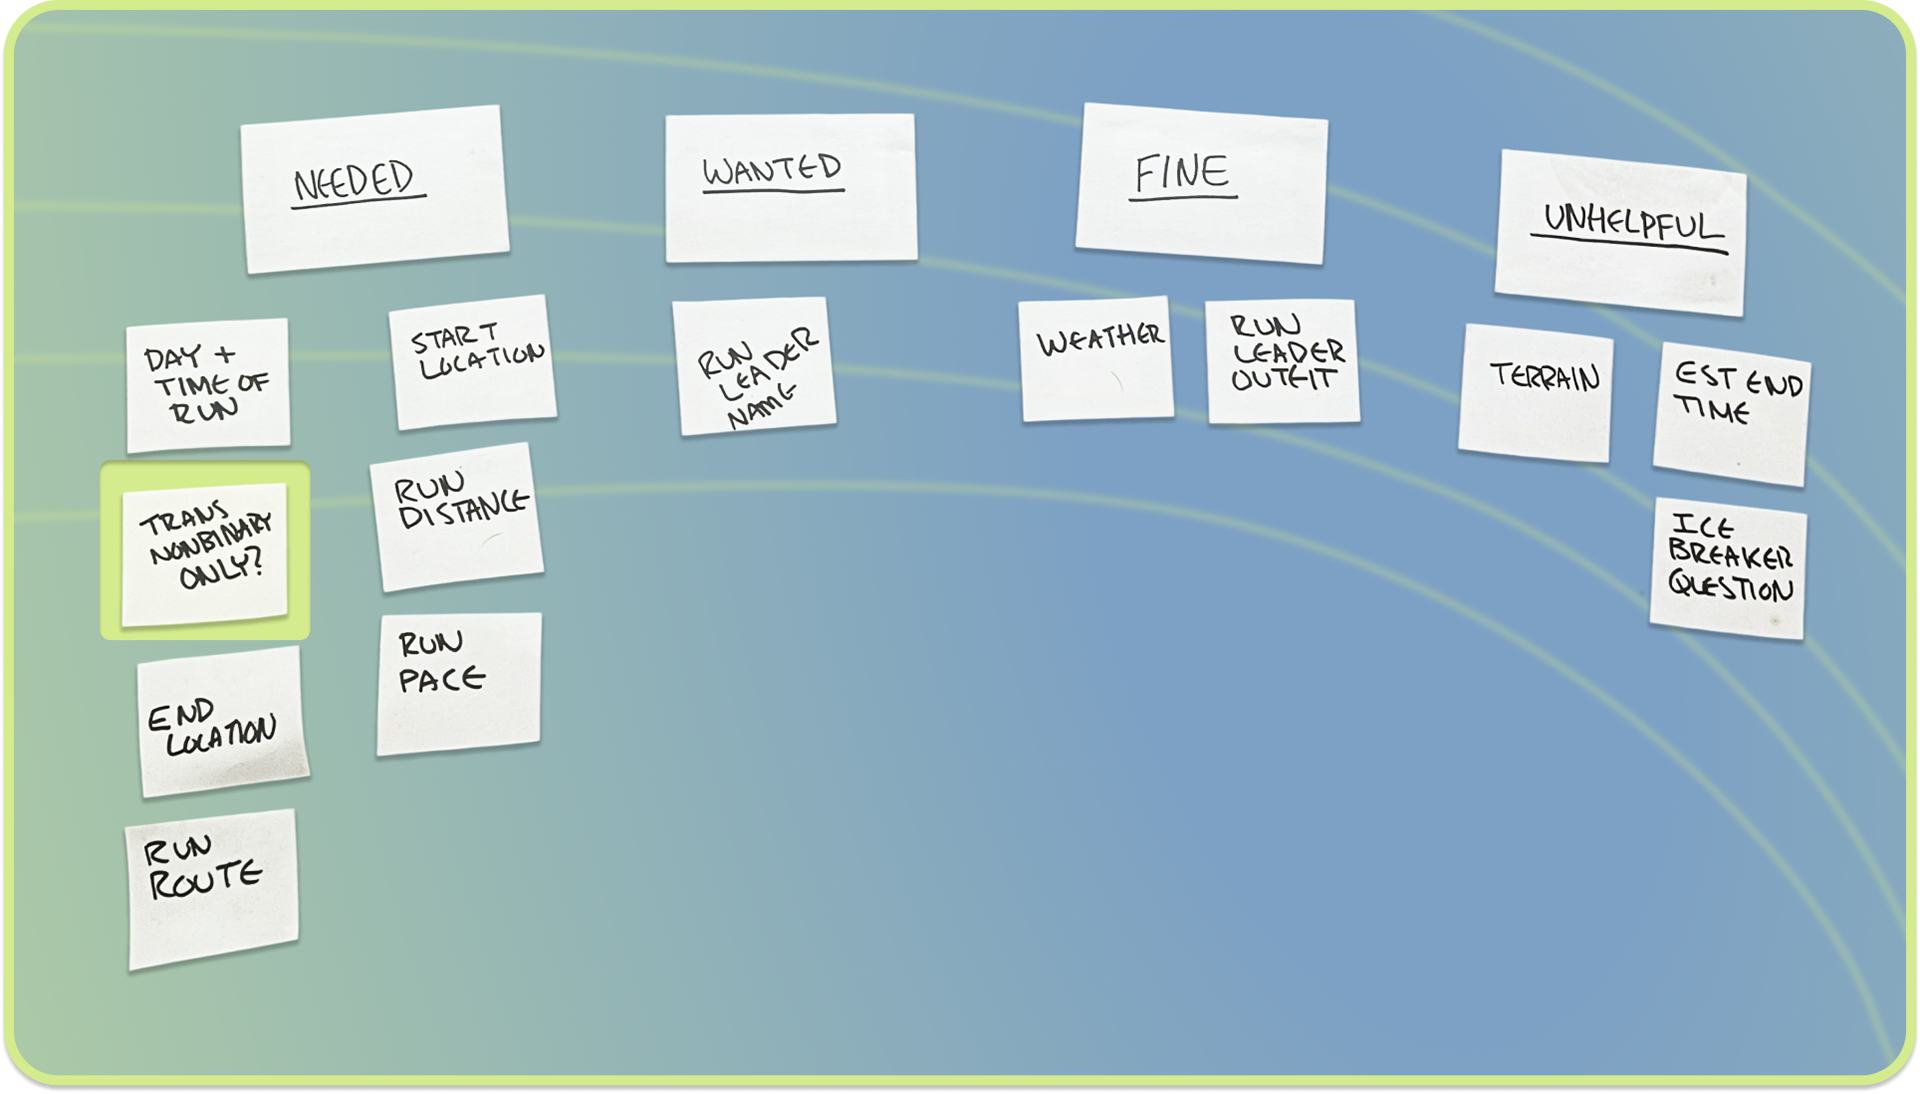
Card Sort test result demonstrating Trans Nonbinary Only or Not? placed as a Need alongside existing list
.
Generally, the card sort confirmed the think-aloud prioritization, with one exception
Trans Non-binary (TNB) Exclusive? — (0 Interview Mentions → 100% 'Needed' Placements Card Sort)
This discrepancy likely occurred because those surveyed were not aware that this was a club offering at the time. Given this variable answers the critical 'Who?' question, I added it to the list in the top tier.
Final hierarchy of info needed to get to a run
1. Day & Time of Run
2. Start Location
3. Trans Nonbinary (TNB) Only or Not?
(most critical above)
4. End Location
5. Distance
6. Route
.
system needs
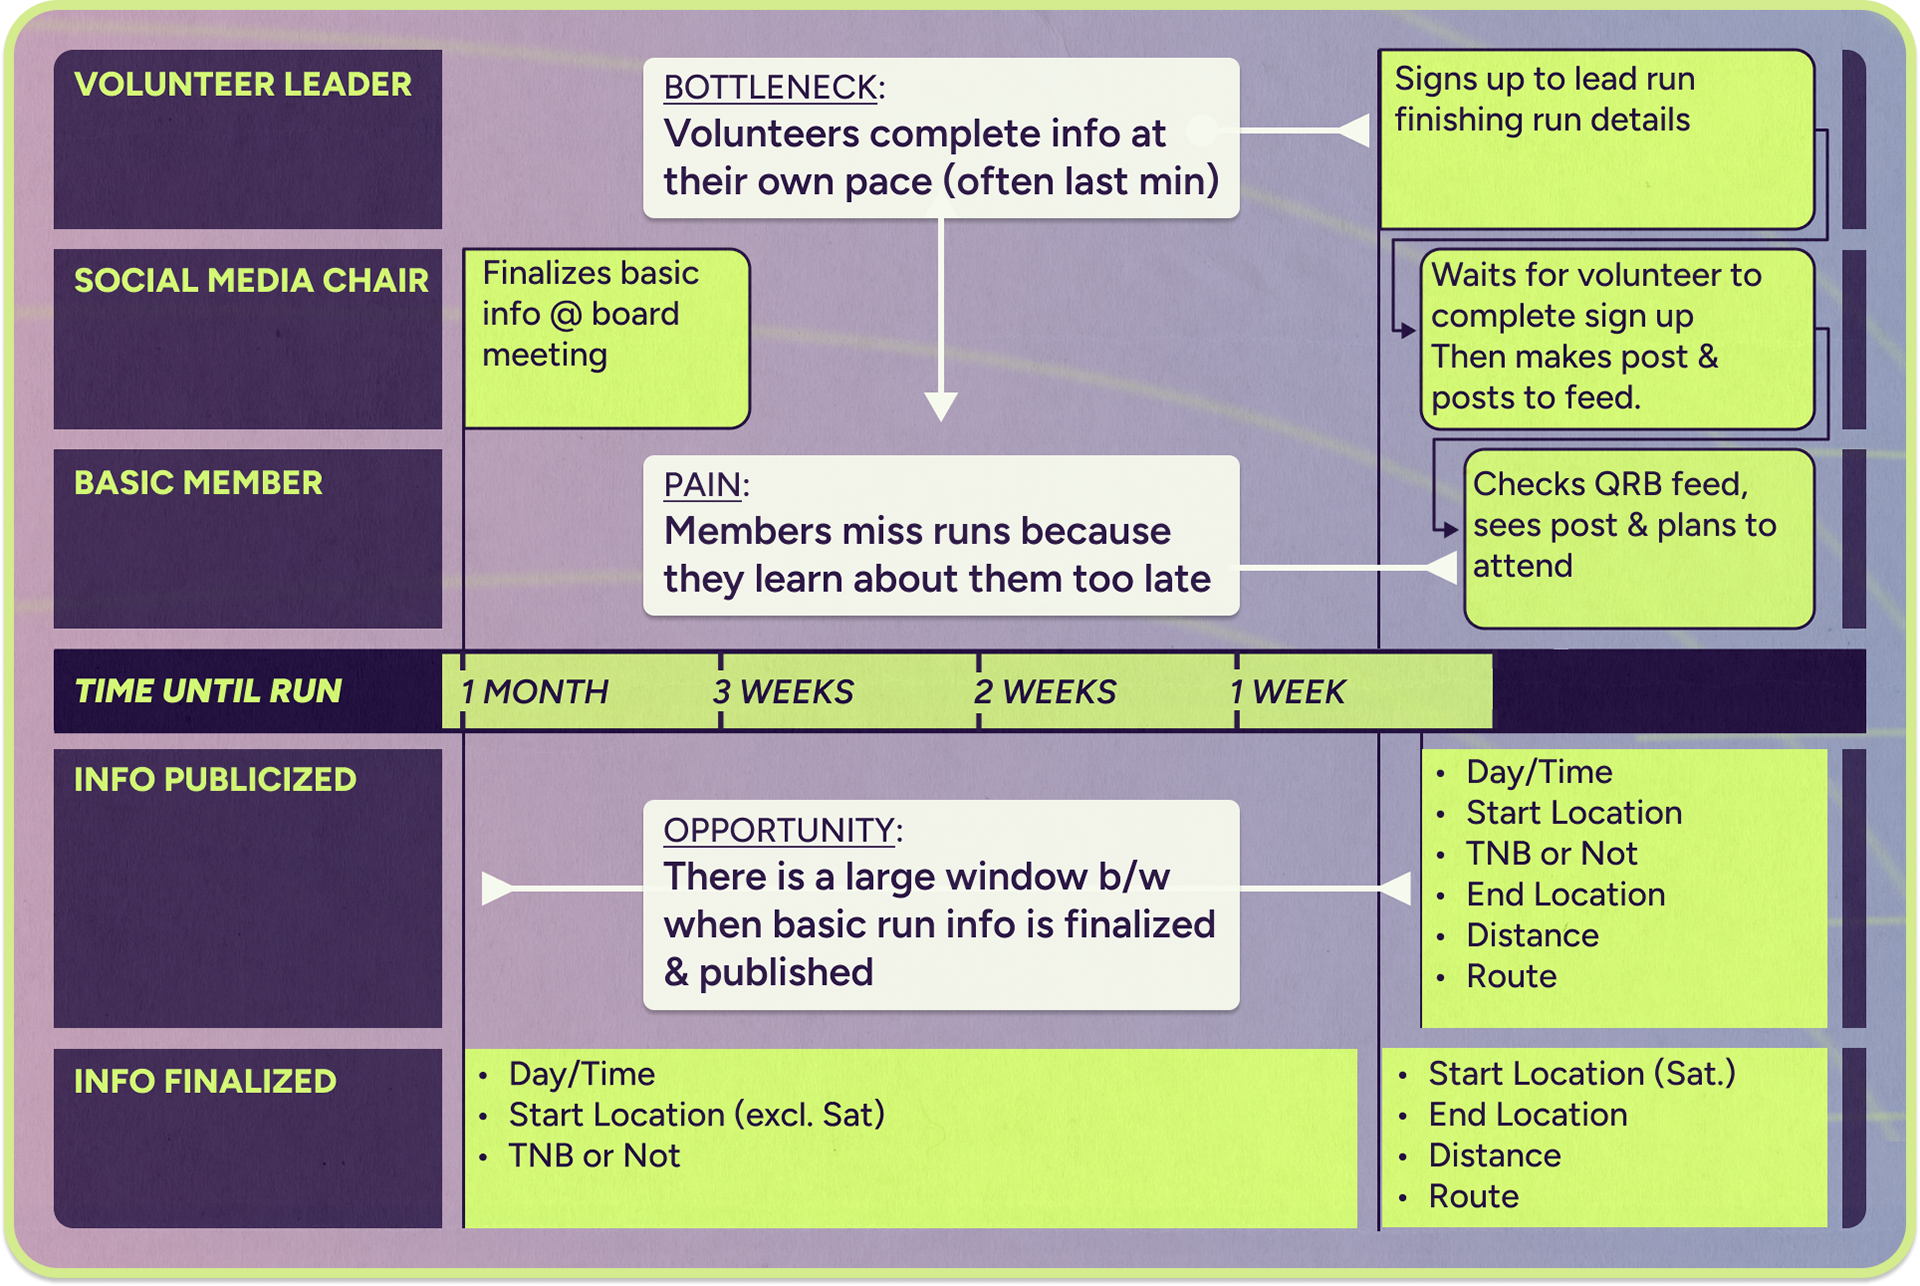
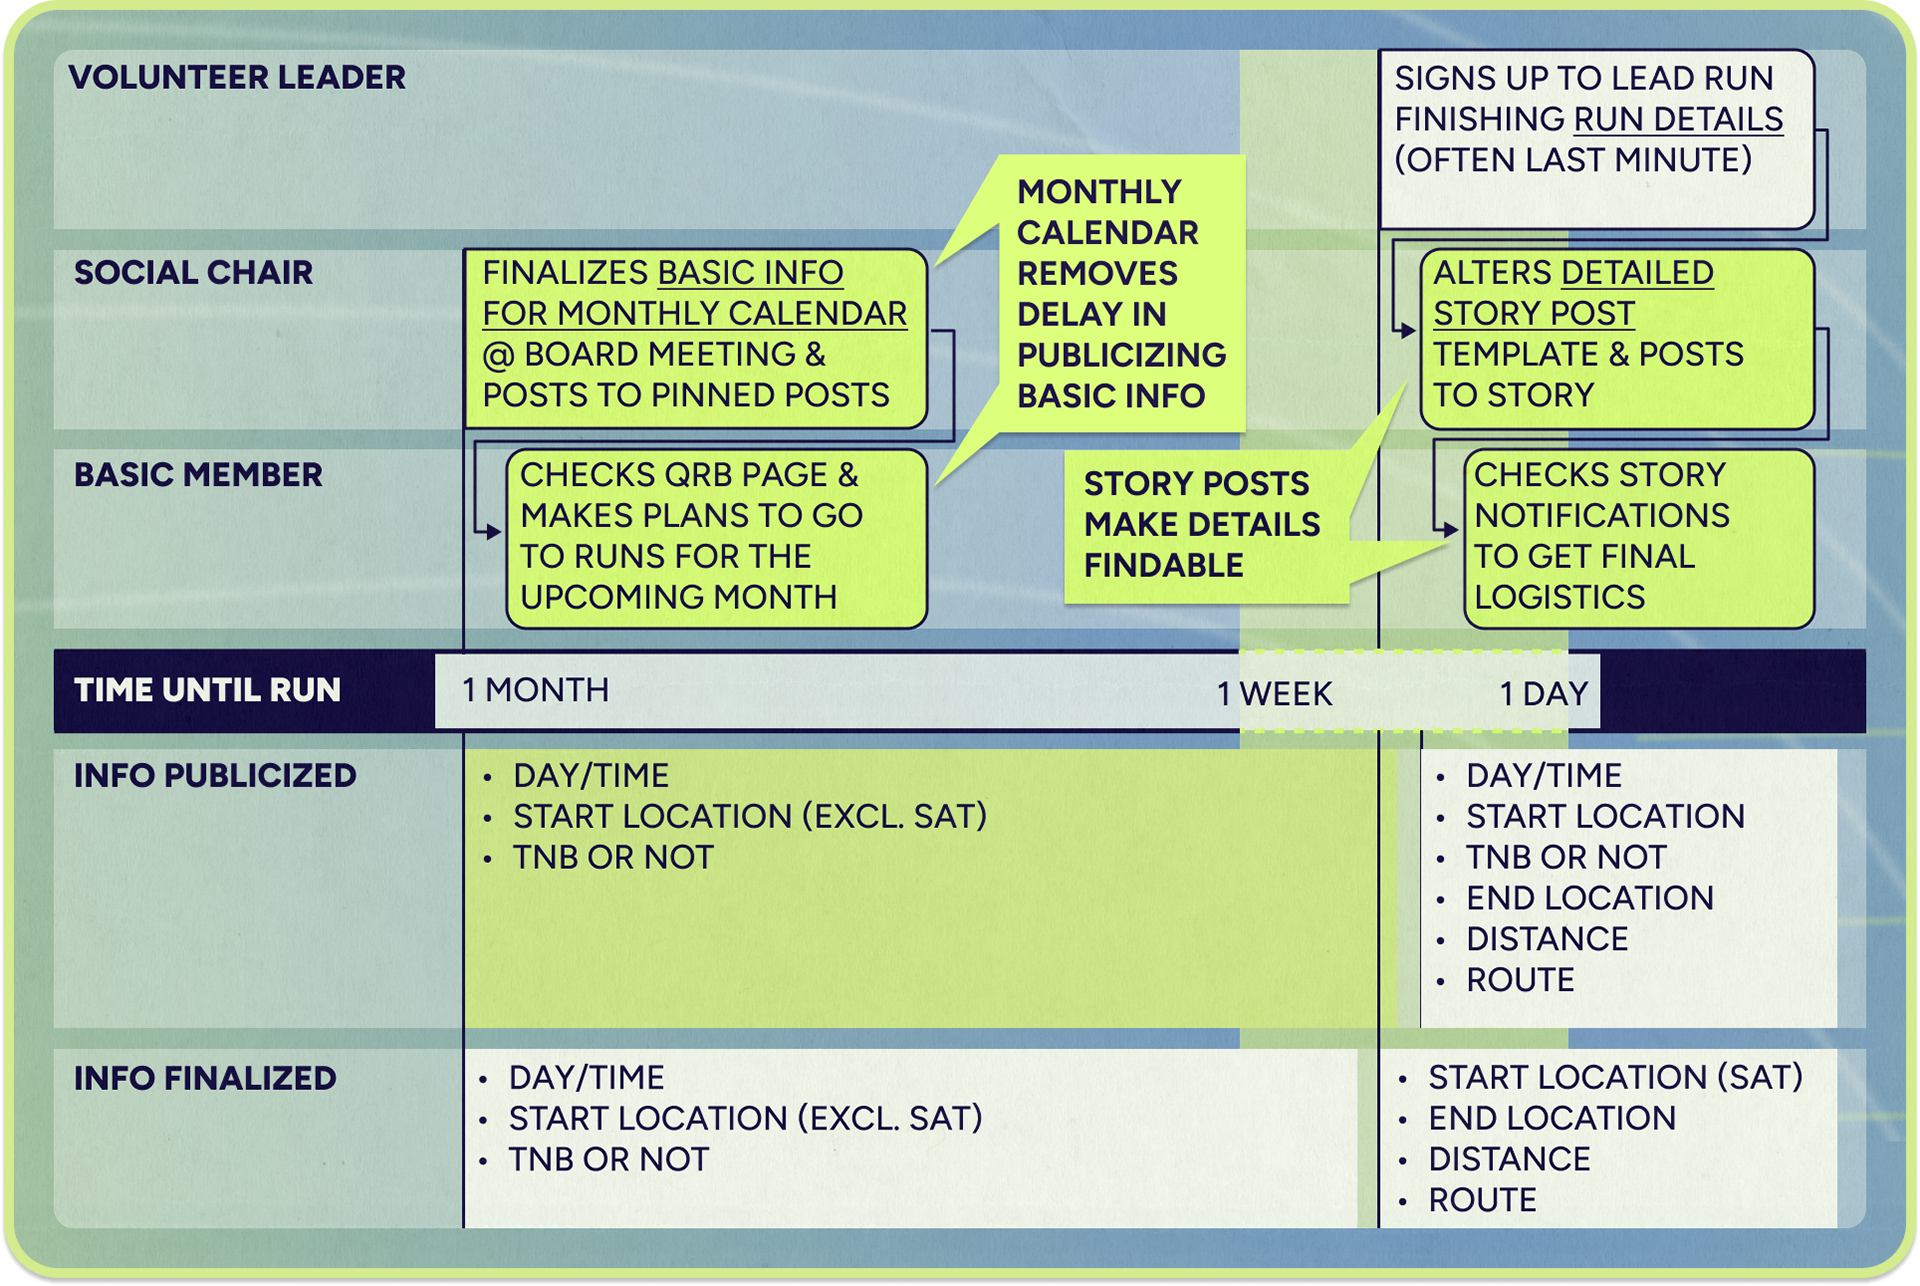
I interviewed members and the social media chair to create a comprehensive current state diagram to model their journeys and the system they exist within to understand where it was failing and how I could support it.
.
.
Current state
I found that in the initial system, the board would finalize basic info a month out and then the social media chair would post about runs on the main instagram feed once volunteers finished signing up.
This often happened the day before a run, which was too late for members to plan to attend, and thus to go to the runs at all. Especially because they weren't notified about feed posts.
Future state
Given that volunteer reliance is central to QRB's identity and that we cannot mandate volunteer behavior, the only resource to get information to members earlier would be the basic info finalized a month before the runs to enabel members to better plan for runs.
That is, a better communication system would need to share board finalized information before volunteer sign up detail to provide a future planning opportunity with a more easily discoverable close to run detail post option.
Define
COMMUNICATION SYSTEM Design Criteria
1. Share board finalized info early to enable future planning
2. Deliver complete details close to run day without requiring members to search for it
3. Reflect the info prioritization from research
4. Maintain QRB's visual identity and ensure visual consistency post to post
iteration 1/4
Monthly Calendar & Daily Story Posts (Manual Map Entry)
To meet the design criteria, circumvent the bottleneck and take advantage of the critical information lead time window I created a two-part solution:
1. Pinned Monthly Calendar for Future Planning
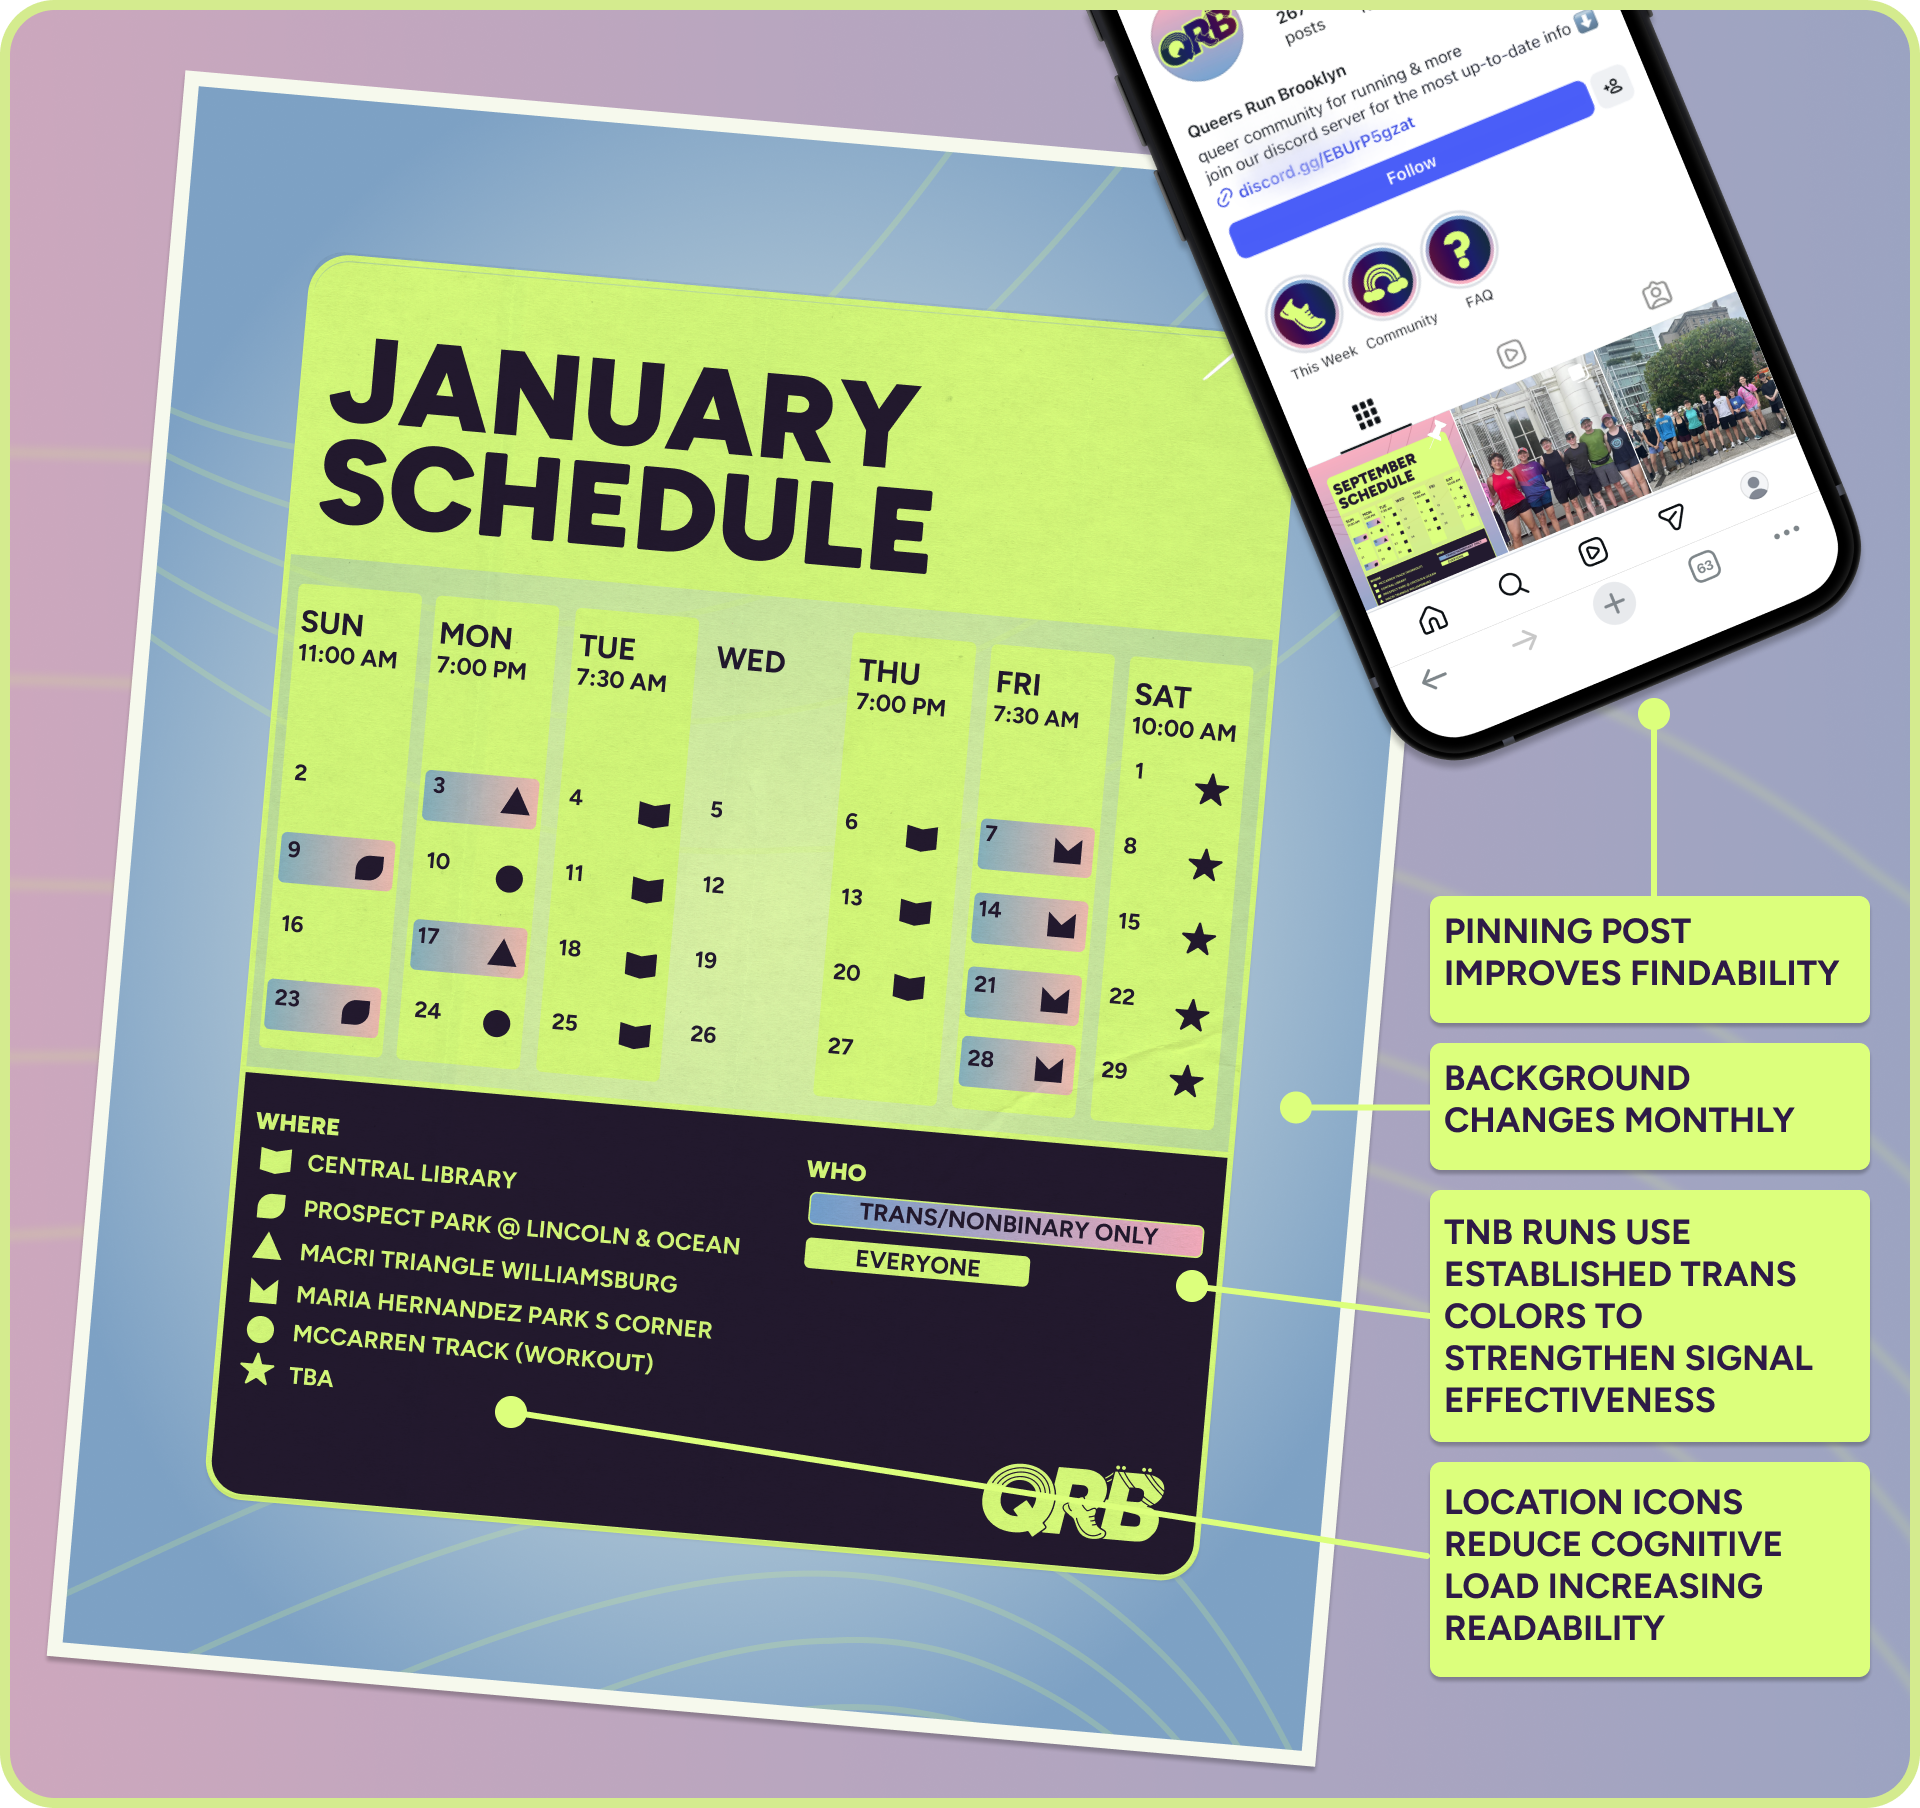
Communicates basic info as soon as the board finalizes it at the beginning of each month enabling members to plan ahead. Pinning this post makes it a referable resource.
2. Story Posts for Last-Minute Detailed Info
Delivers the complete picture, including volunteer added details, close to run day enabling members to make more concert plans. Inherent story post notifications increase discoverability vs previous grid post.
.
.
monthly calendar
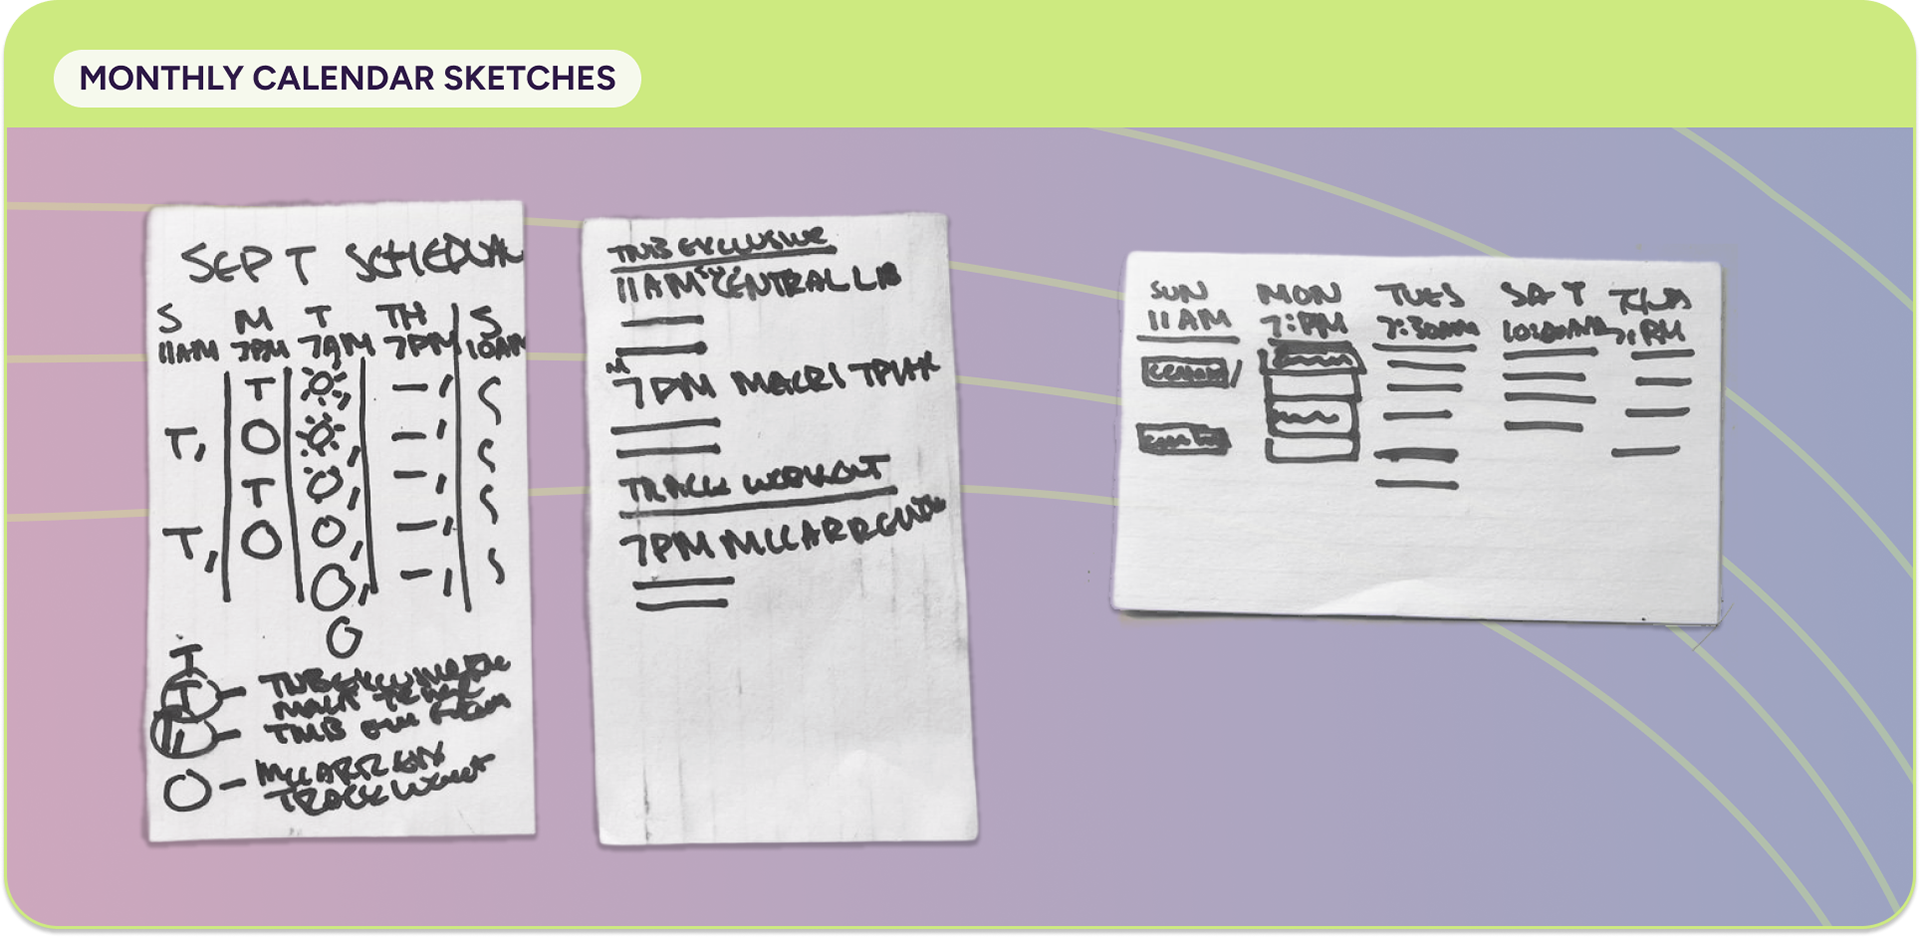
I recreated instagrams constraints in lo-fidelity by drawing with a thick marker on index cards. This tactic made it clear that writing out all information for each date would be overwhelming and unreadable.
.
.
To make this information manageable, I color coded runs to indicate TNB or not and created icons to represent standard start locations.
Given this is a response to board meetings, I took responsibility for the monthly design and visual consistency.
.
.
daily story posts
Here I needed to extend the calendars design solution to a different format and a fuller information set, while ensuring usabiluty for the social media chair who does not have design experience.
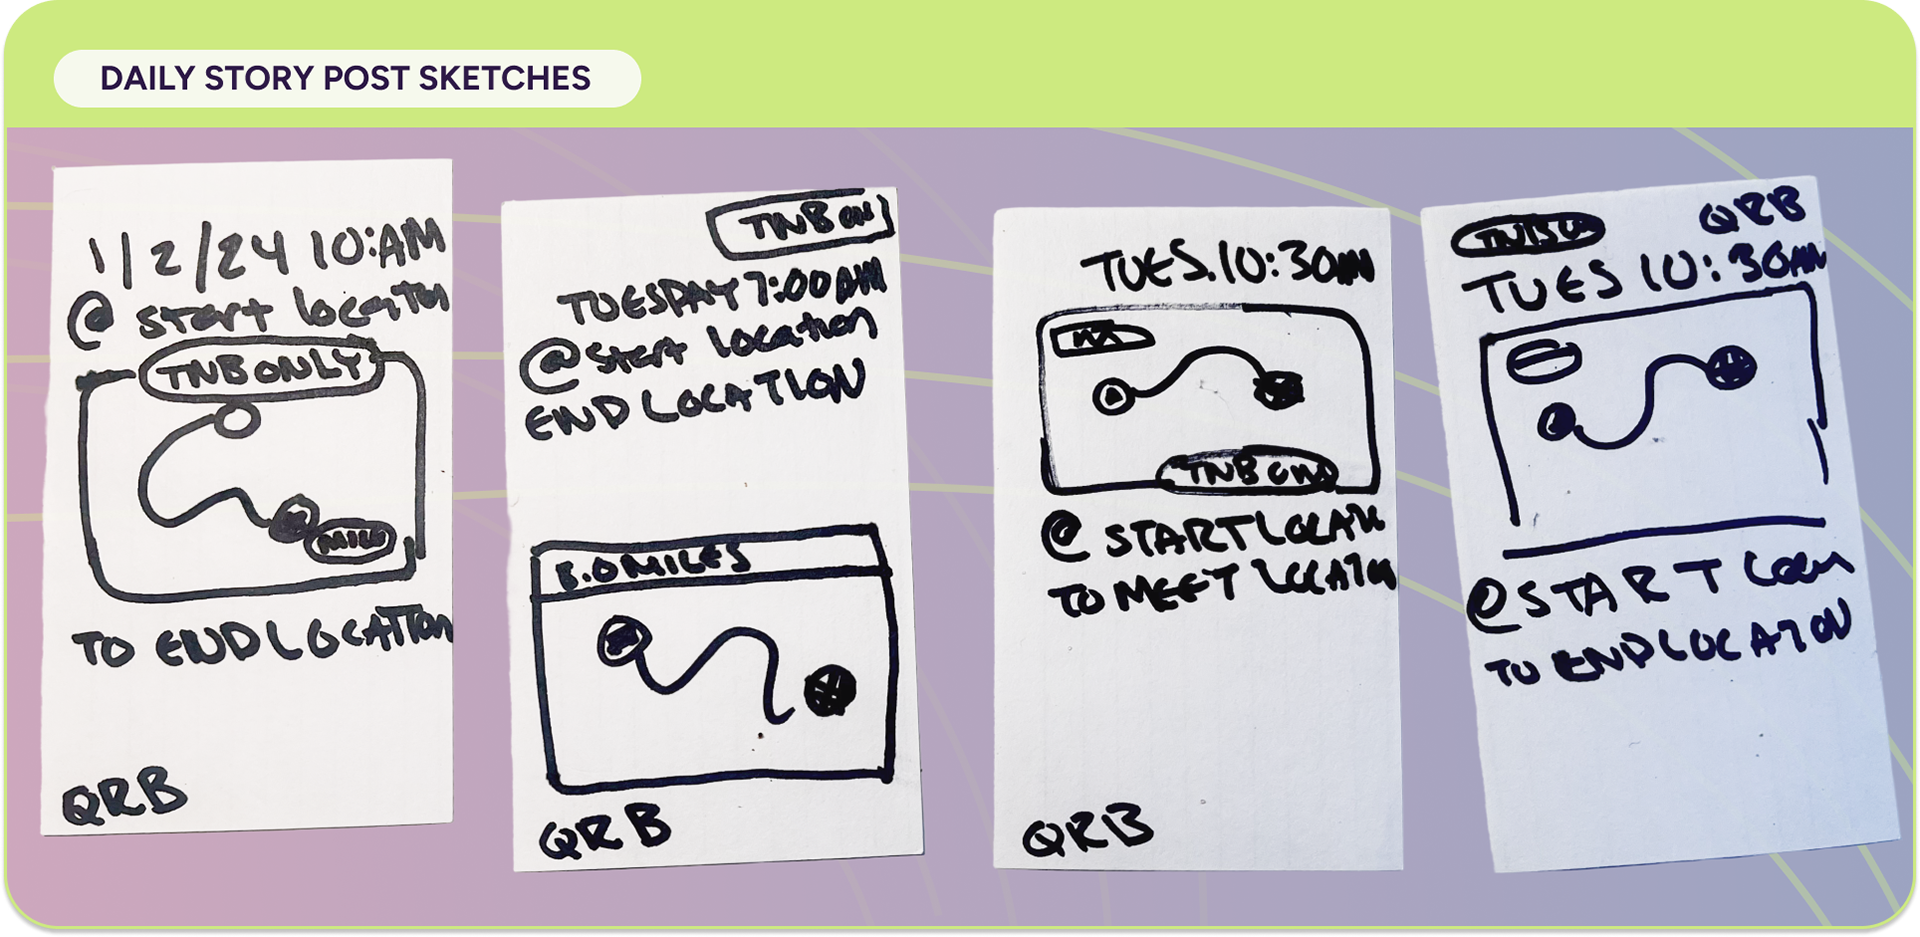
To ensure readability I again iterated using the index card process to develop structure. Then in Figma I utilized the QRB run database to ensure font sizes would fit edge case location titles.
.
.
To enable usability for the social media chair, I created a clear decision tree (3 layer choices and 6 location options) in Figma and walked through the system to ensure they could operate it independently.
.
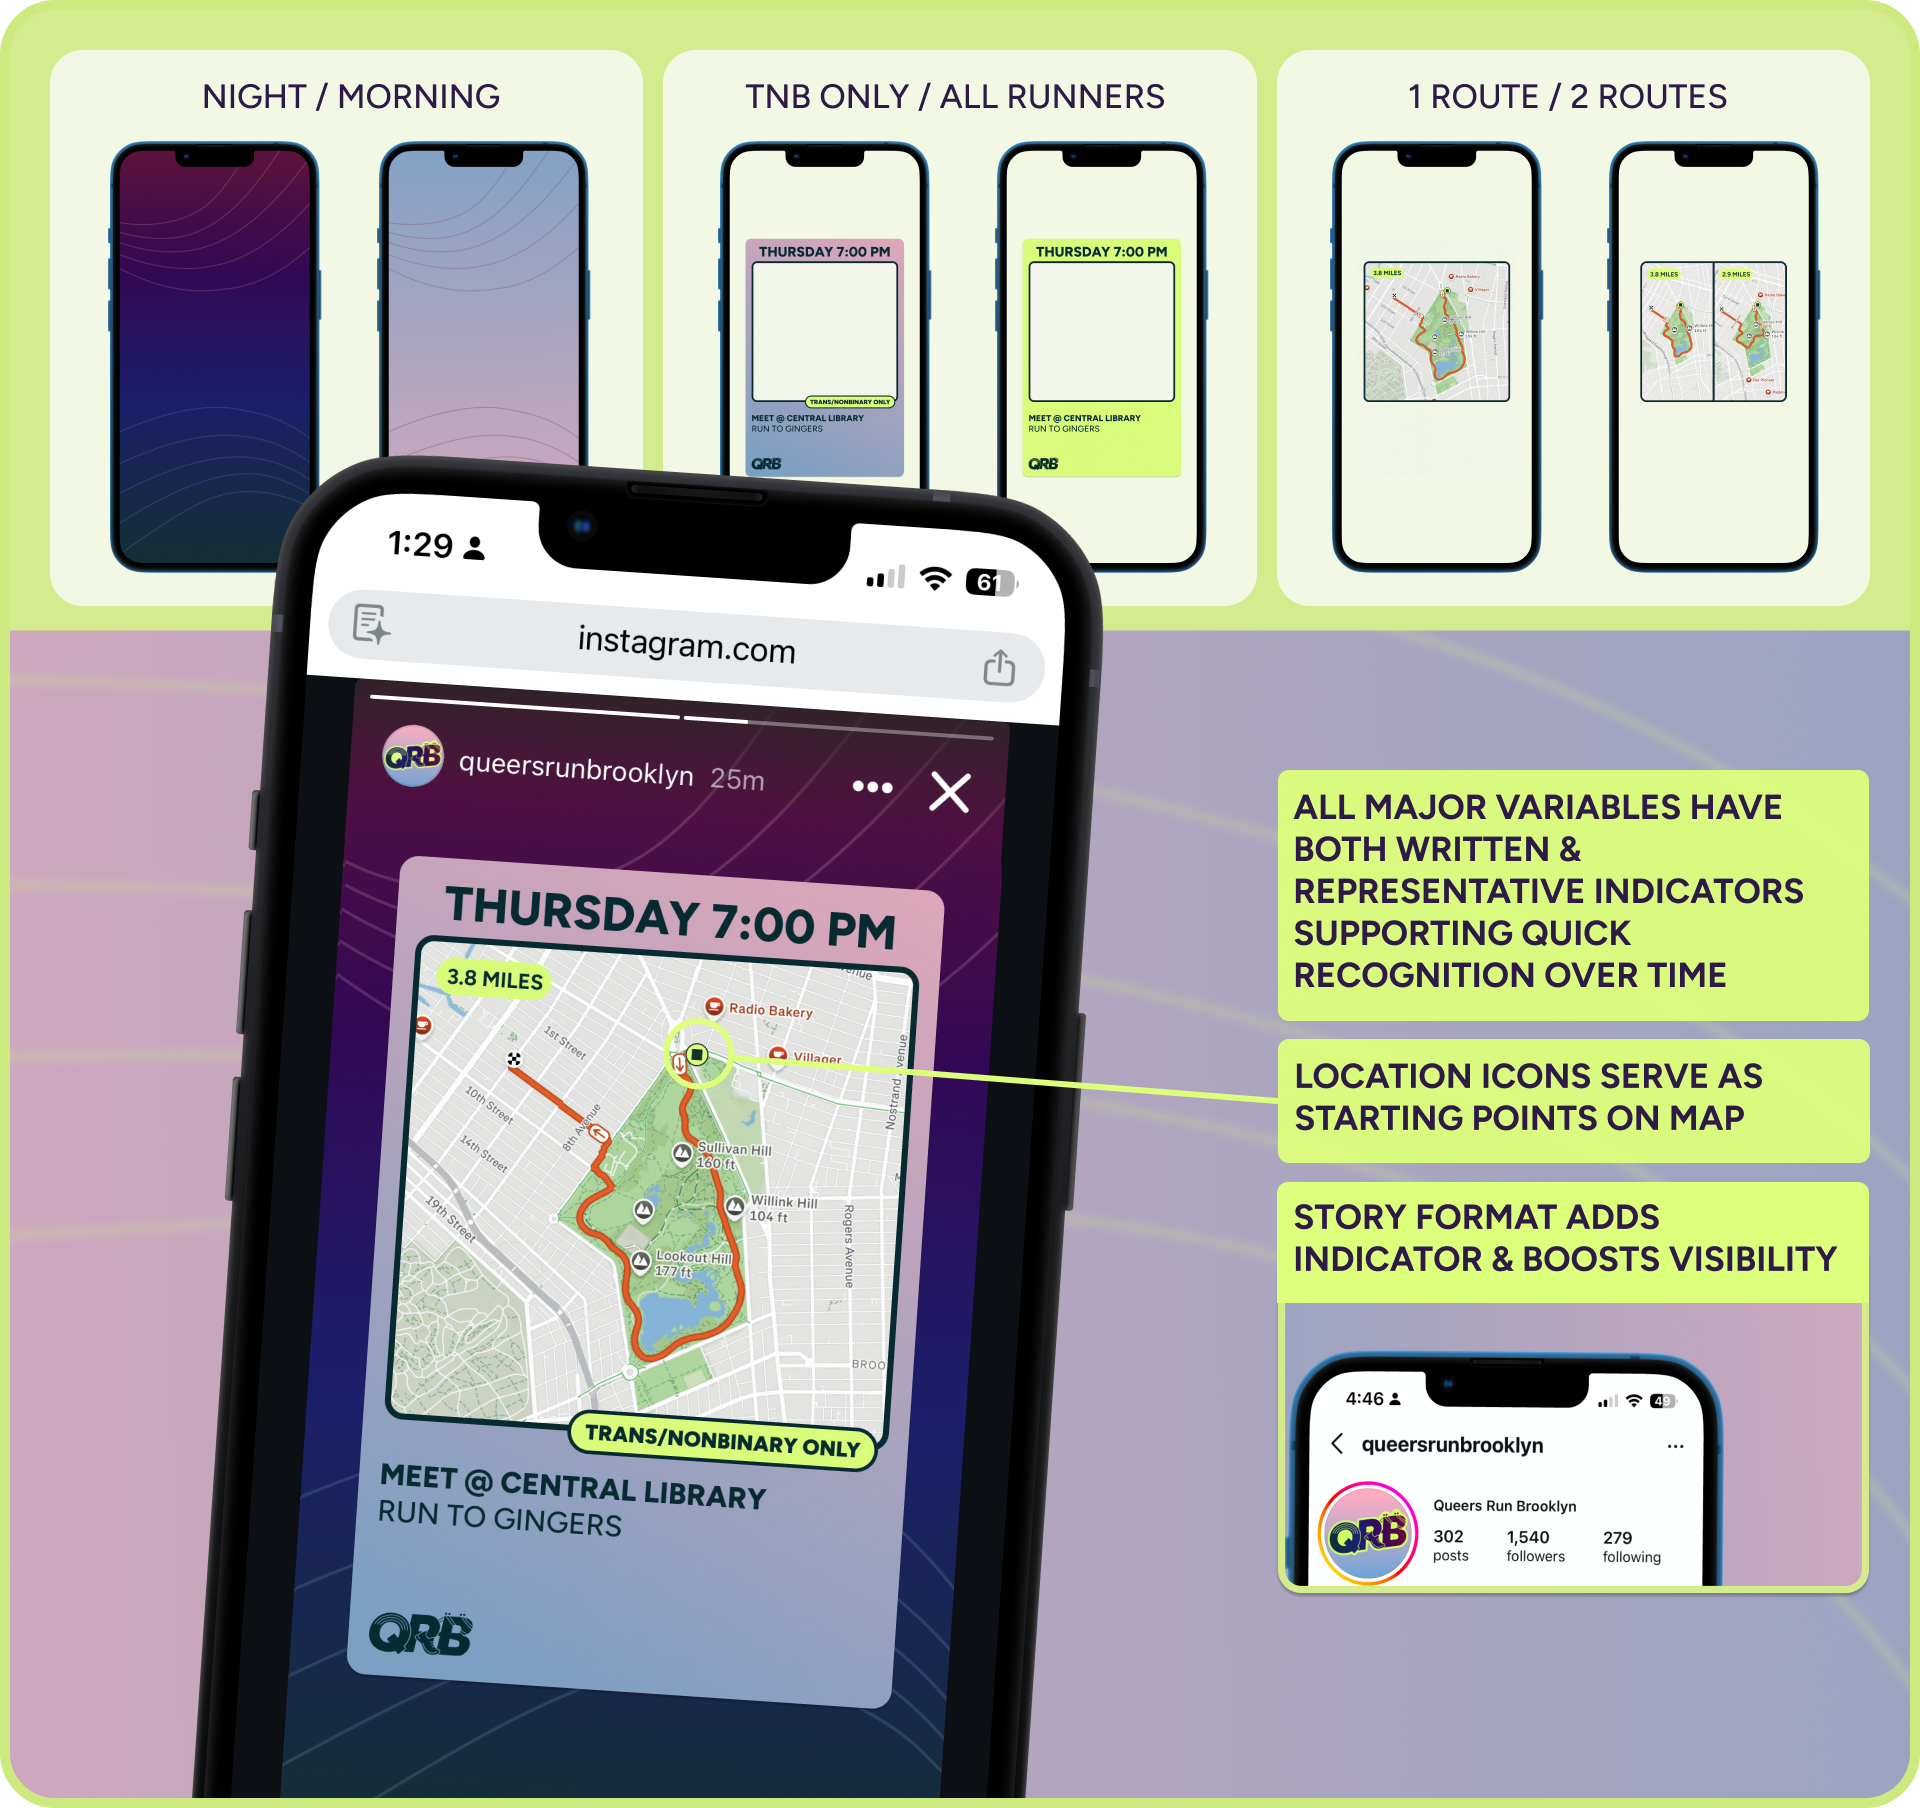
.
initial Feedback on 2 part solution
Members love the calendar and the stories, but it takes the social media chair too long to make story posts
The calendar and the stories received overwhelmingly positive feedback from our members. With members noting an increased ease in attending runs.
However, I noticed the social media chair constantly modifying the story post designs, breaking the visual consistency of the system, and signalling that my designs may lack necessary affordances.
TESTING
To understand the underlying issue I ran a think-aloud interview asking asked the social media chair's to walk through creating a post in real time.
results
Adding maps of routes to story posts is difficult and time consuming.
The social media chair would add routes by taking a screenshot of the route on Strava and adding that screenshot into a template, which often did fit cleanly into the map space.
To accommodate this, the social media chair spent a long time adjusting the map's orientation, zoom level, and positioning, and if it was taking too long or got too frustrating she would give up and change the designs structure disrupting consistency post to post!
"78% of my time is spent just getting that in the right place and sometimes I have to give up so the designs just cannot be the same."
— Social Media Chair explaining why they created new templates.
iteration 2/4
Replacing Maps with Club Photos in story posts to Save Time
Upon re-evaluation, I identified adding the route map as both the most time-consuming step and the lowest-ranked element in the research, so I got rid of them.
I replaced maps with photos of the club, shifting the focus to community rather than logistics and eliminating the screenshot bottleneck thereby speeding up the process.
While the routes were gone, I made sure to continue to build on visual consistency, by placing start location markers in the upper corner of each run club image.
Solution
.
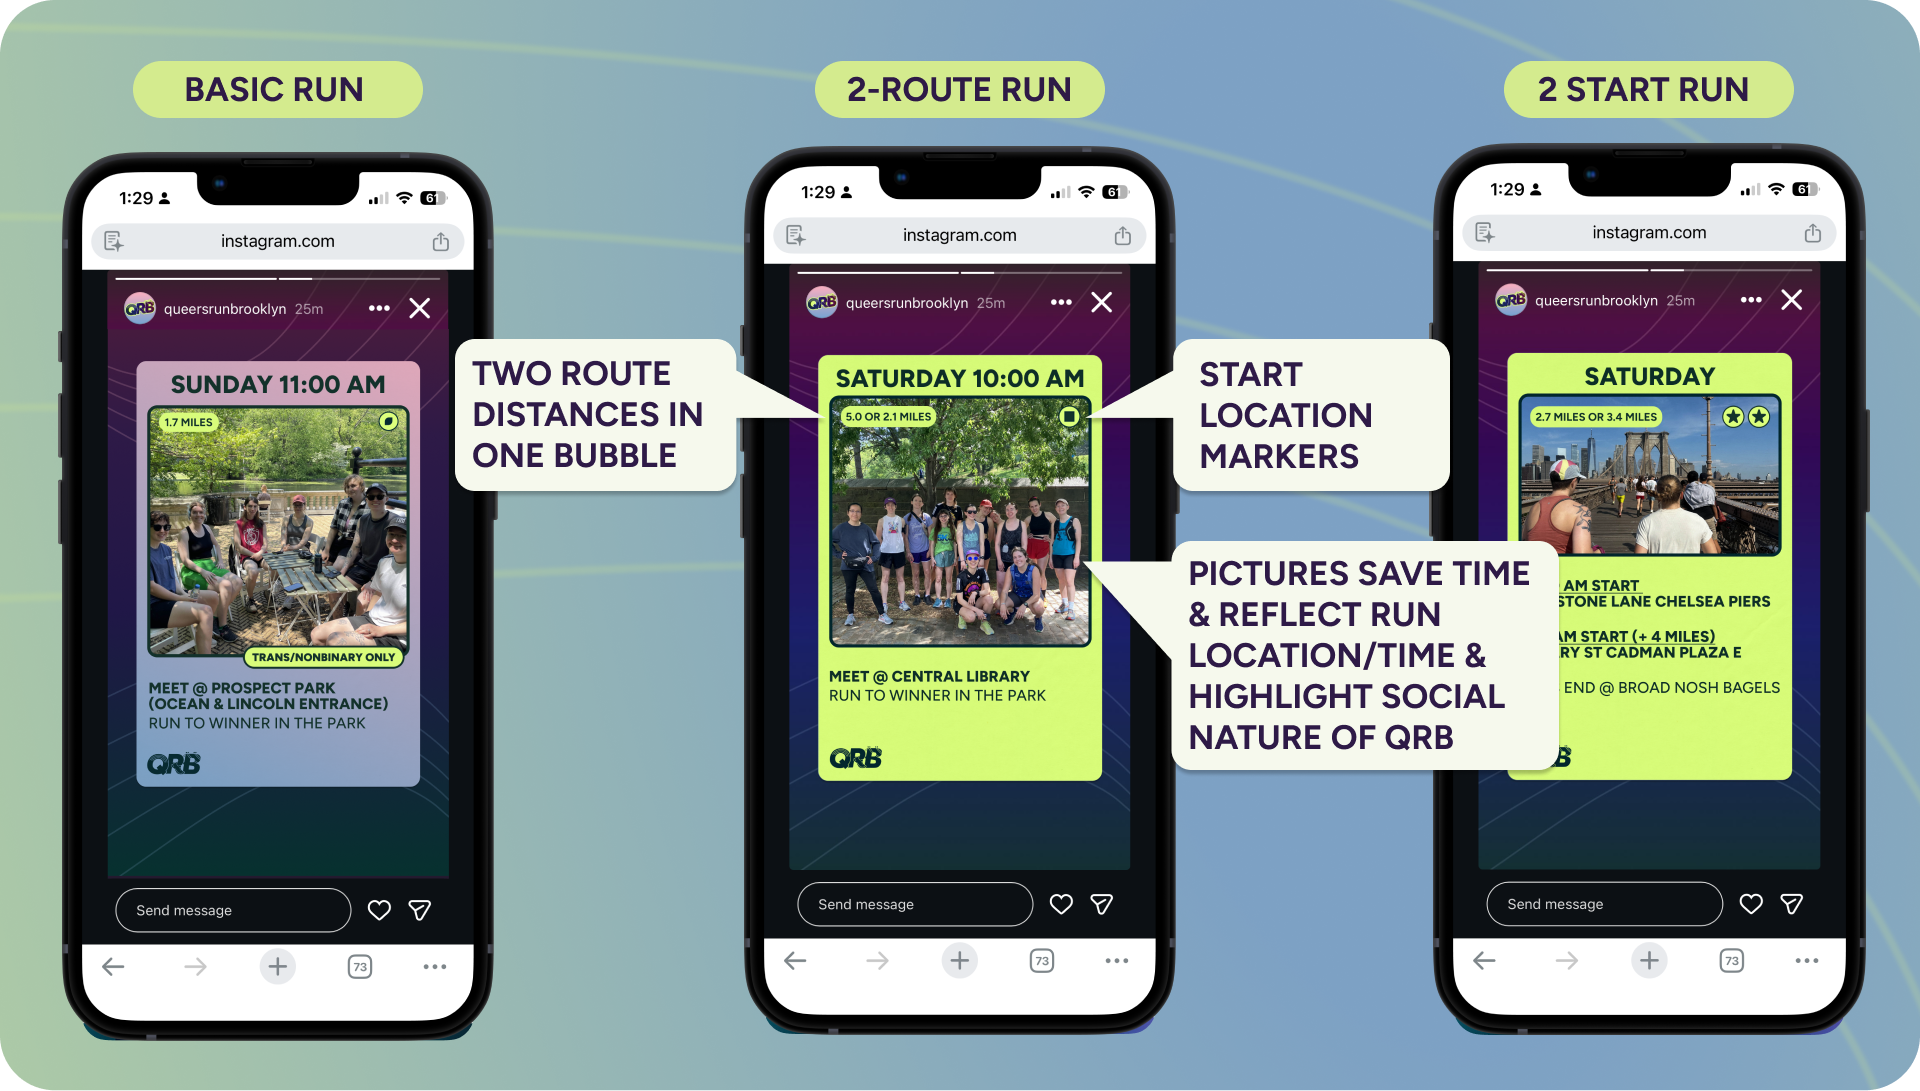
.
Testing
I ran a timed think-aloud with the social media chair using the new templates, and conducted think-aloud interviews with new members on the redesigned posts.
Result
Removing the map was faster for the social chair, but made finding the start location (a critical step in getting to a run) harder for members.
The map wasn't just a display for the route, it acted a clarifying tool for the start location. The map visually anchored the start location in a way that text couldn't replicate. Without it, members struggled to orient themselves to where the run began.
"I accidentally went to the wrong Nitehawk Cinema because I couldn't tell it wasn't the one by me."
— Member explaining how the new template caused them to miss a run.
Moreover, when attempting to compensate for this loss the social media chair had to look up questions and add clarifying text while still gathering data from Strava, eliminating all time savings and making posts denser and less readable.
iteration 3/4
(PIVOT!) Automating Map Input on story posts to save time
Given the consequences of removing a map were dire, I needed out a new, less manually taxing way to add maps to story posts, so I turned to automation.
Process
1. selecting an automation method
I began by exploring three technical approaches, as I wanted to understand the process that my tool would support, and ensure that it would work. I selected downloadable GPX files with Leaflet/OpenStreetMap rendering to bring the solution to life with the formatting I desired.
.
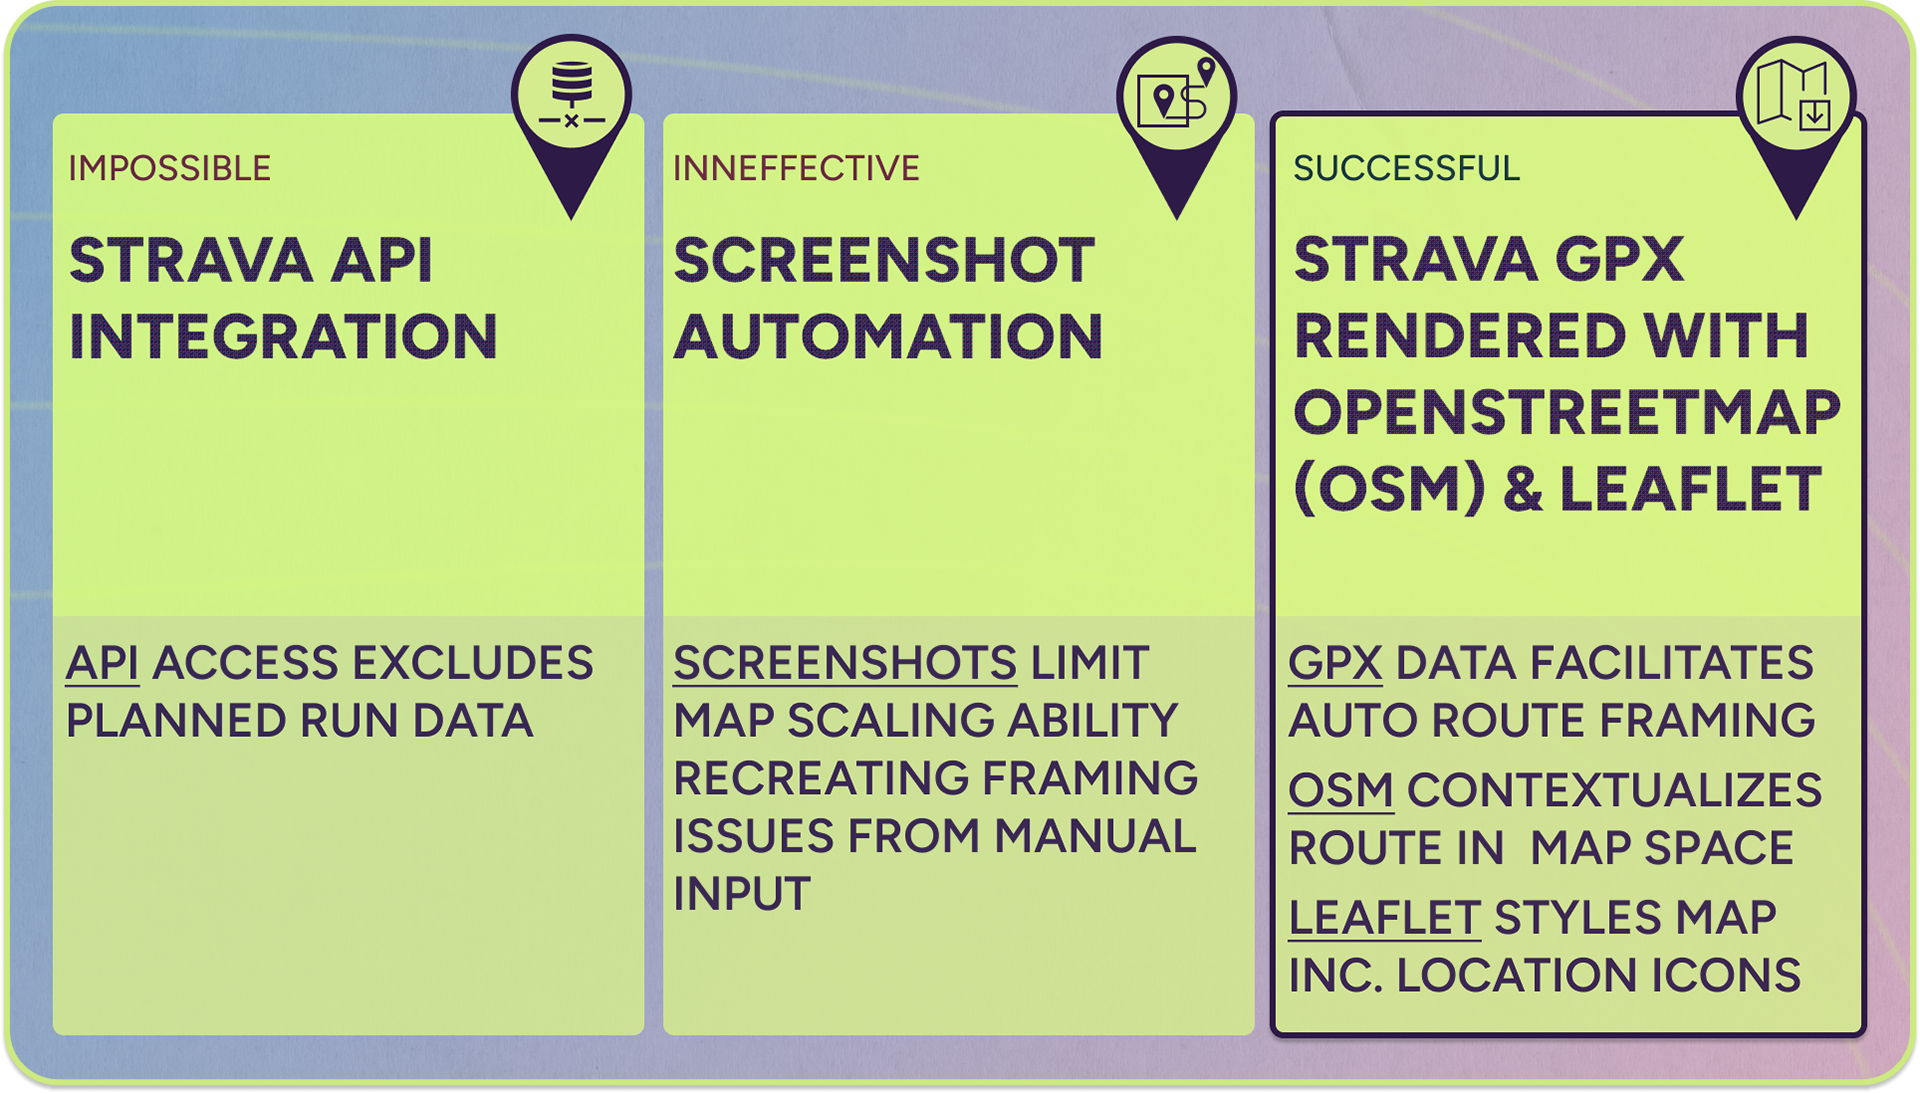
.
2. Detrmining NECESSARY Tool Structure
Knowing how I was going to get the routes into the page. I now needed to figure out how I was going to get all of the other information in there.
I wrote a list of information and use cases for this story creator and split it into manual or automated input and then designed a user interface to enable manual input and reassure users that auto input was working in order of importance based on earlier research.
fRont end (User manual input)
- GPX File*
- Day & Time of Run (AM/PM→ Background Color)
- Trans Nonbinary (TNB) Only or Not?
- Start Location
- End Location
Back end (derived from gpx Input)
- Distance
- Route
- # of Routes
- # of Starts
- Start Location Icon Selection*
*Added to list for continuity with process calendar
3. Designing Visual representtion
I sketched out wireframe options by hand for these manual inputs keeping user needs and the design goal in mind and then transferred promising ones into Figma.
I used Figma Make to build a working web application that automates the hardest parts of the story post creation workflow.
sOLUTION
.
Making a post step by step
.
Highlighted features
Auto-zoom and positioning improves posting speed
The tool automatically frames the uploaded route, eliminating the primary time sink
Start location detail views ease orientation difficulties
A second zoomed-in view of the start location, only possible through automation, reduces the need for descriptive text and directly addresses the orientation problem members experience by adding more readable maps
"I only knew to go to this corner because I could see exactly where we were starting"
- user on the benefits of new zoomed in view.
...
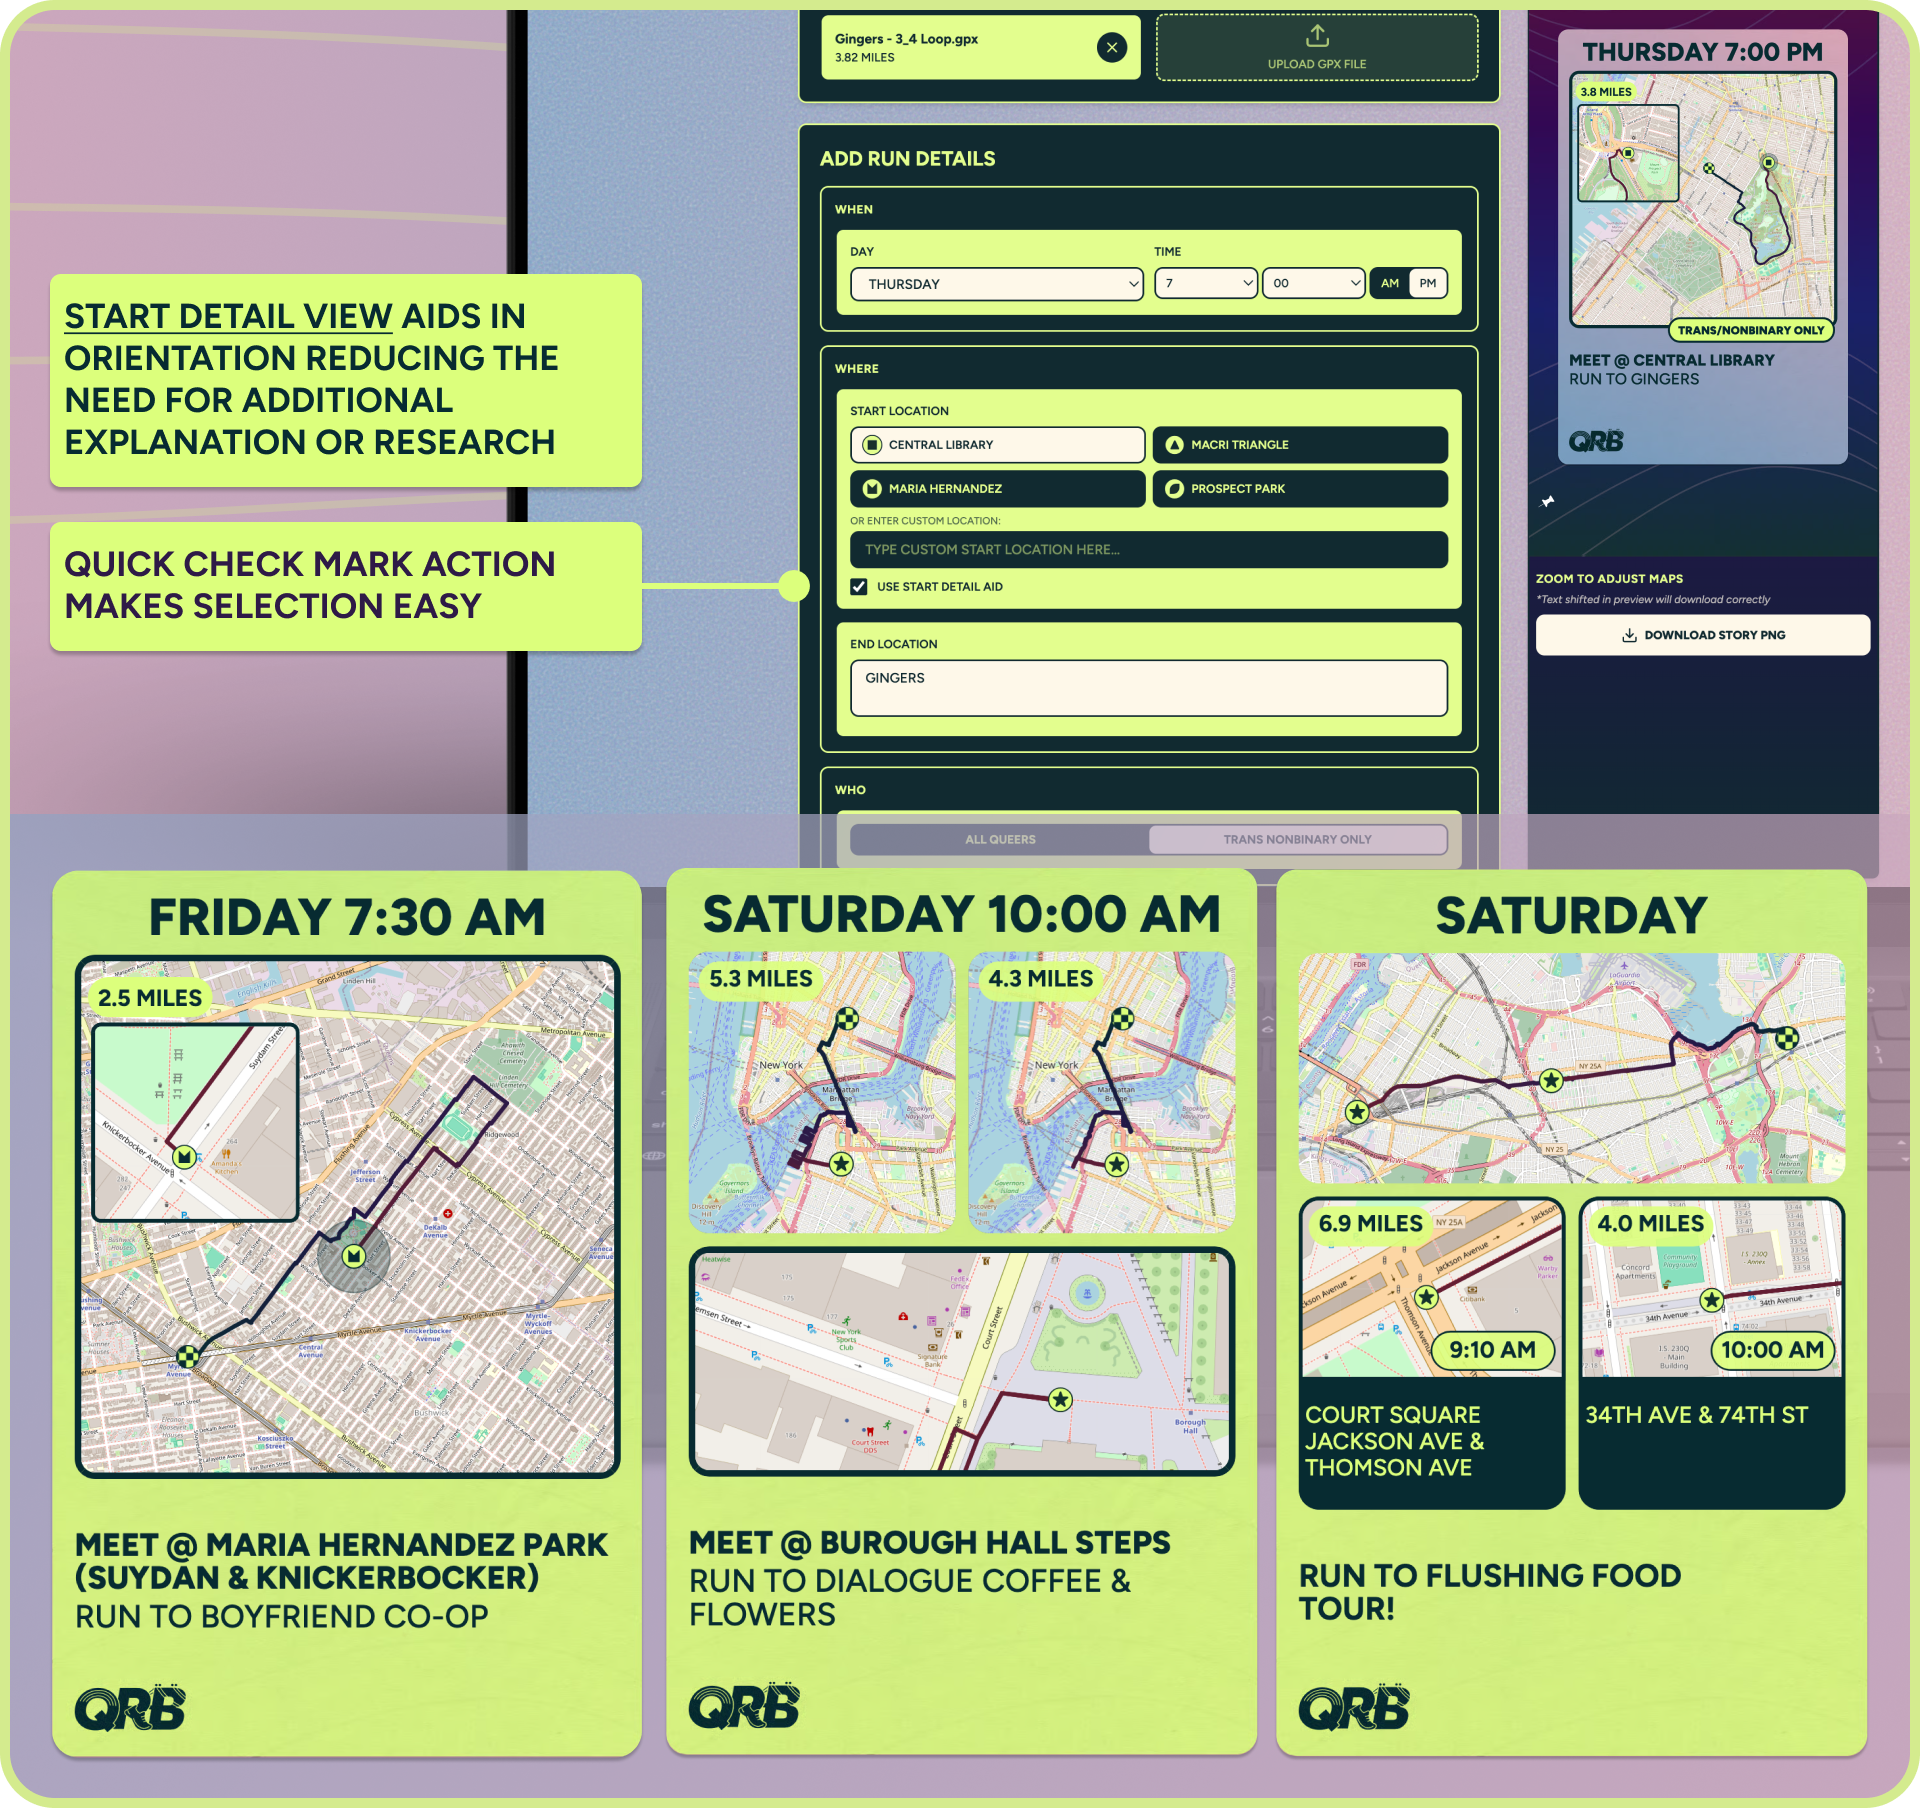
.
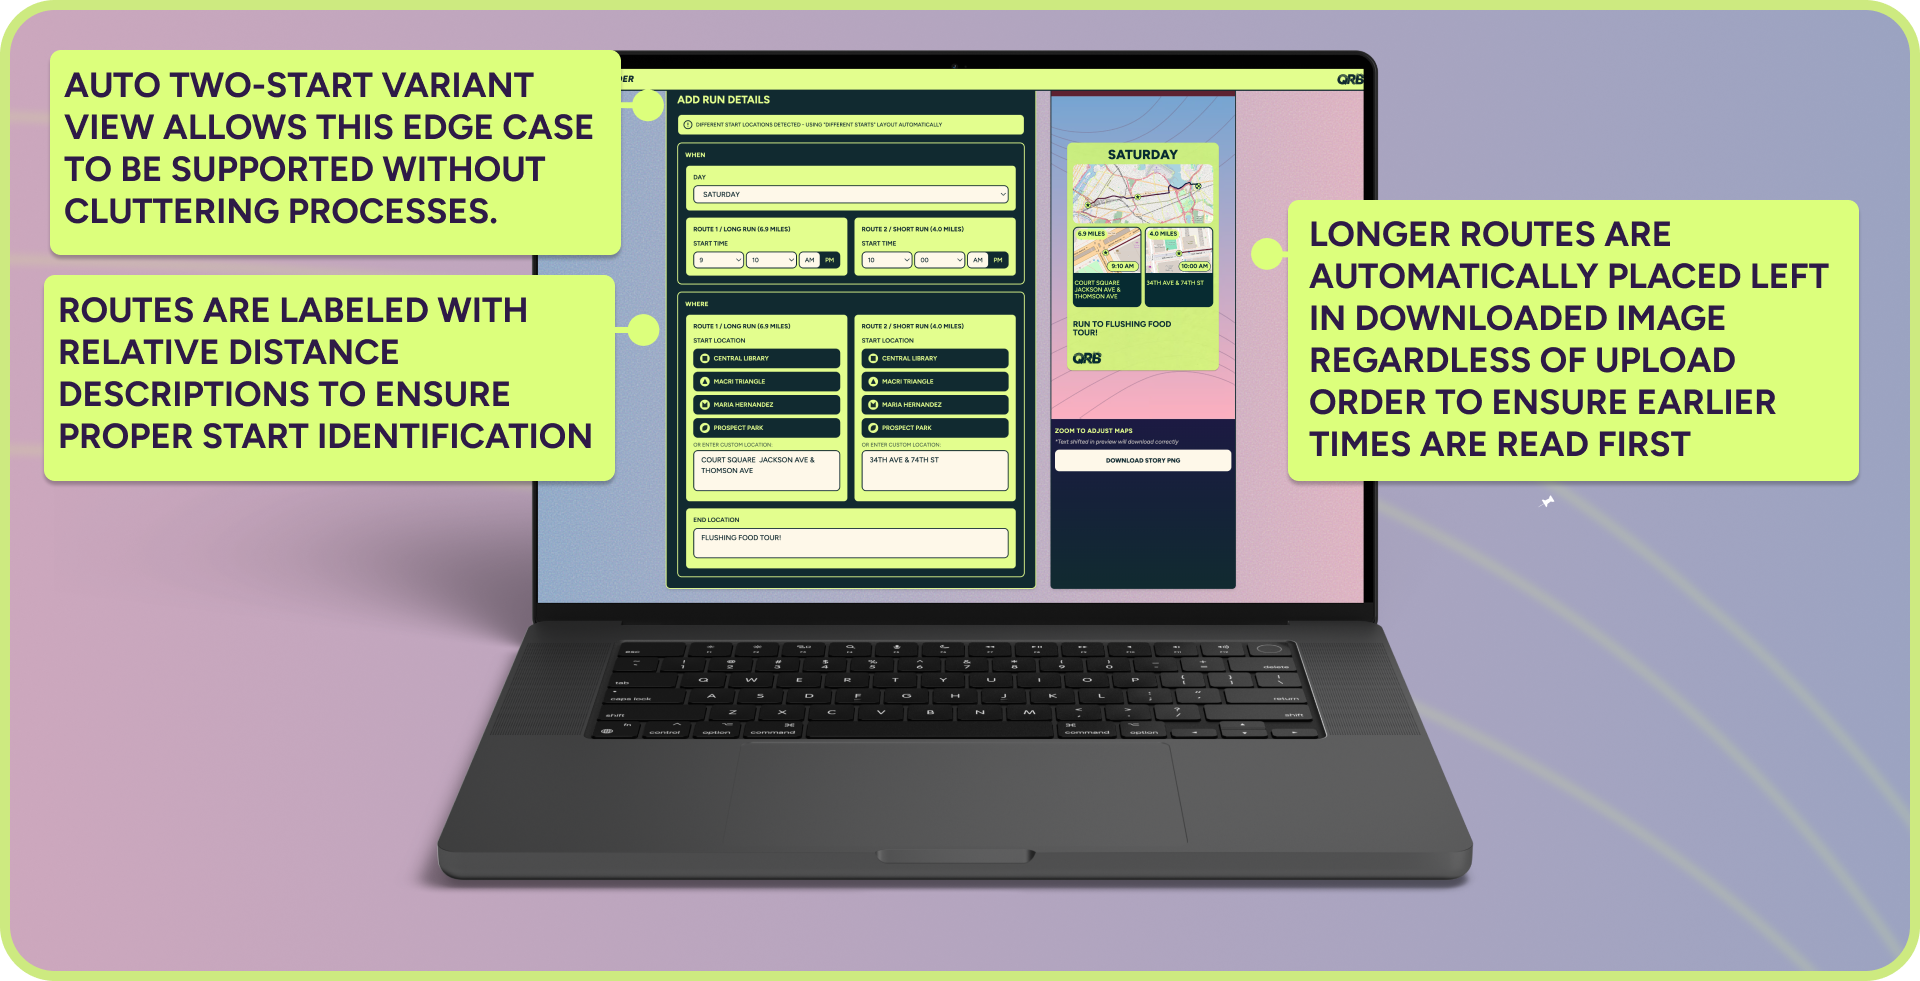
Auto start location detection simplifies story post choice
Automatically generates the two-start variant, handling the most common edge case without a new file.
,,
.
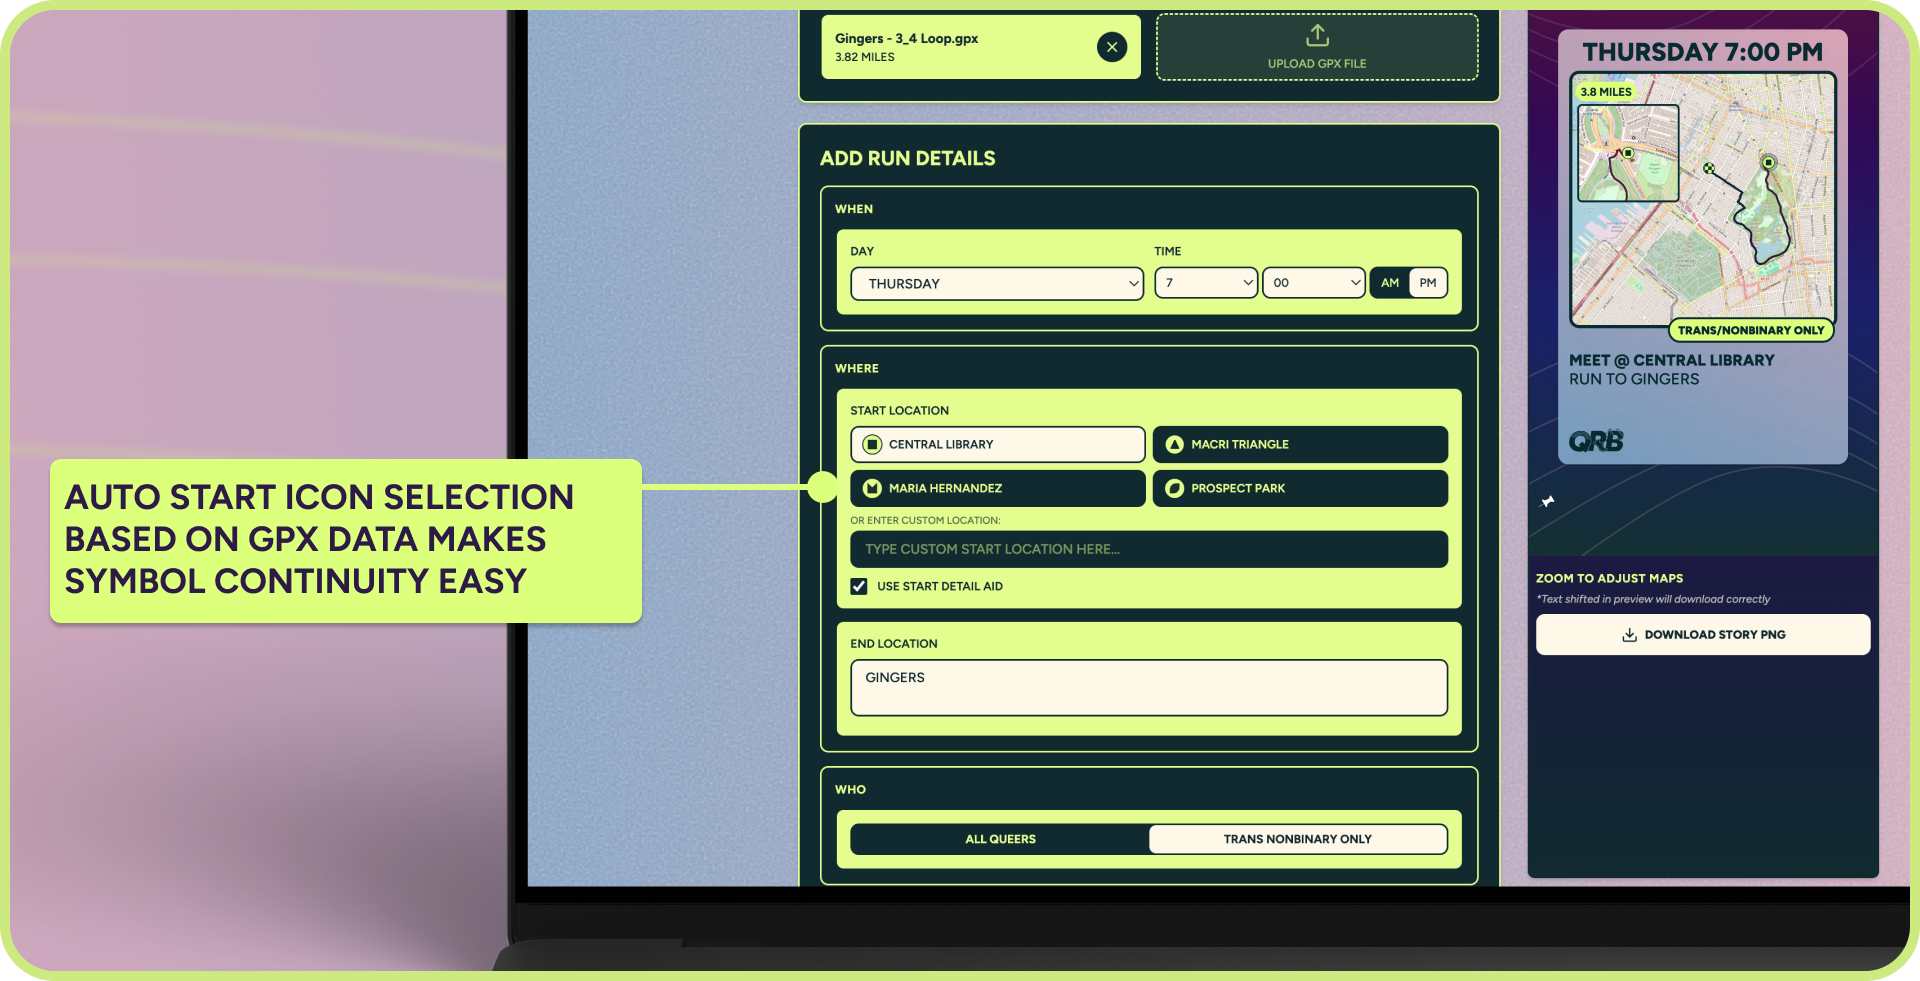
Preset location icons with predictive selection supports visual continuity
Pre-loaded icons for common QRB start locations maintain visual language continuity from the calendar. When a route starts by one of these locations that start location with be automatically selected reducing strain further.
.
.
Testing
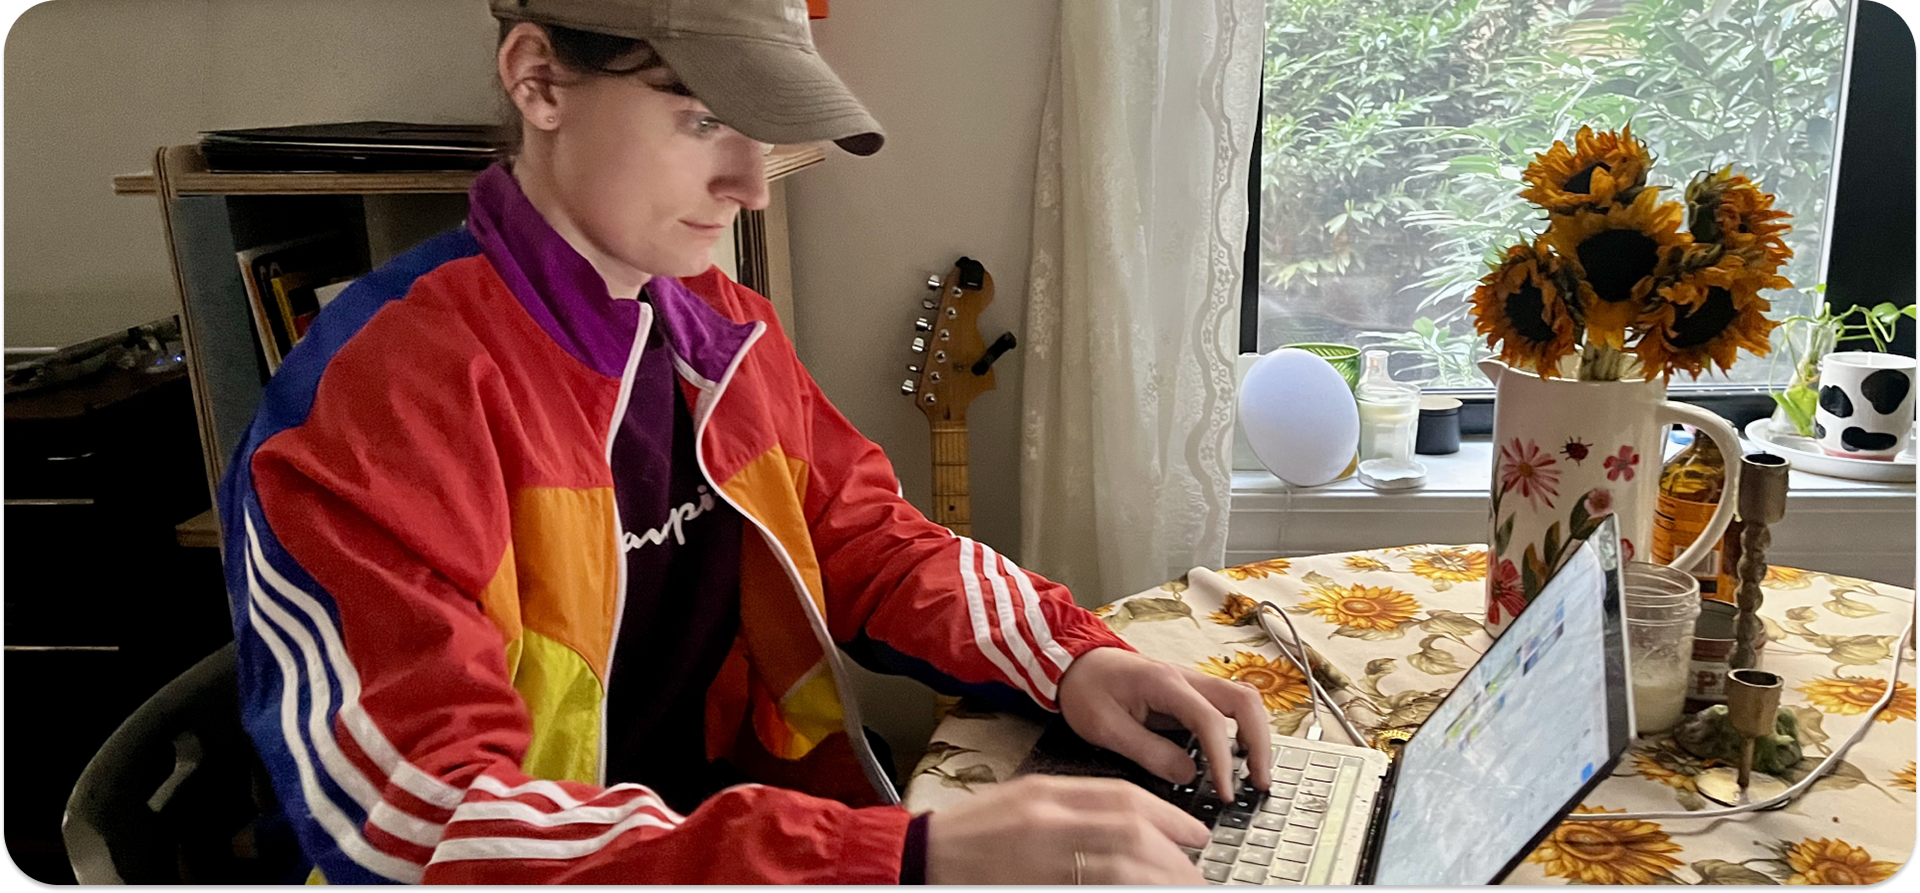
To test the effectiveness of my solution, I ran a trial where the Social Media Chair created posts for runs using either the old method or the new automated system with route inputs for routes with similar difficulty 5 times each across the one route basic start, one route different start, 2 route 1 start, and 2 route 2 start cases
.
Testing - Old System in View
.
Results
Timed testing confirmed that this solution was incredibly effective an increasing the social media chair's total posting capacity.
Single route post:
85% Faster (03:55 → 00:35)
Two-route post:
73% Faster (05:58 → 01:11)
Two-start posts:
97% Faster (45:00 → 01:12)
Iteration 4/4
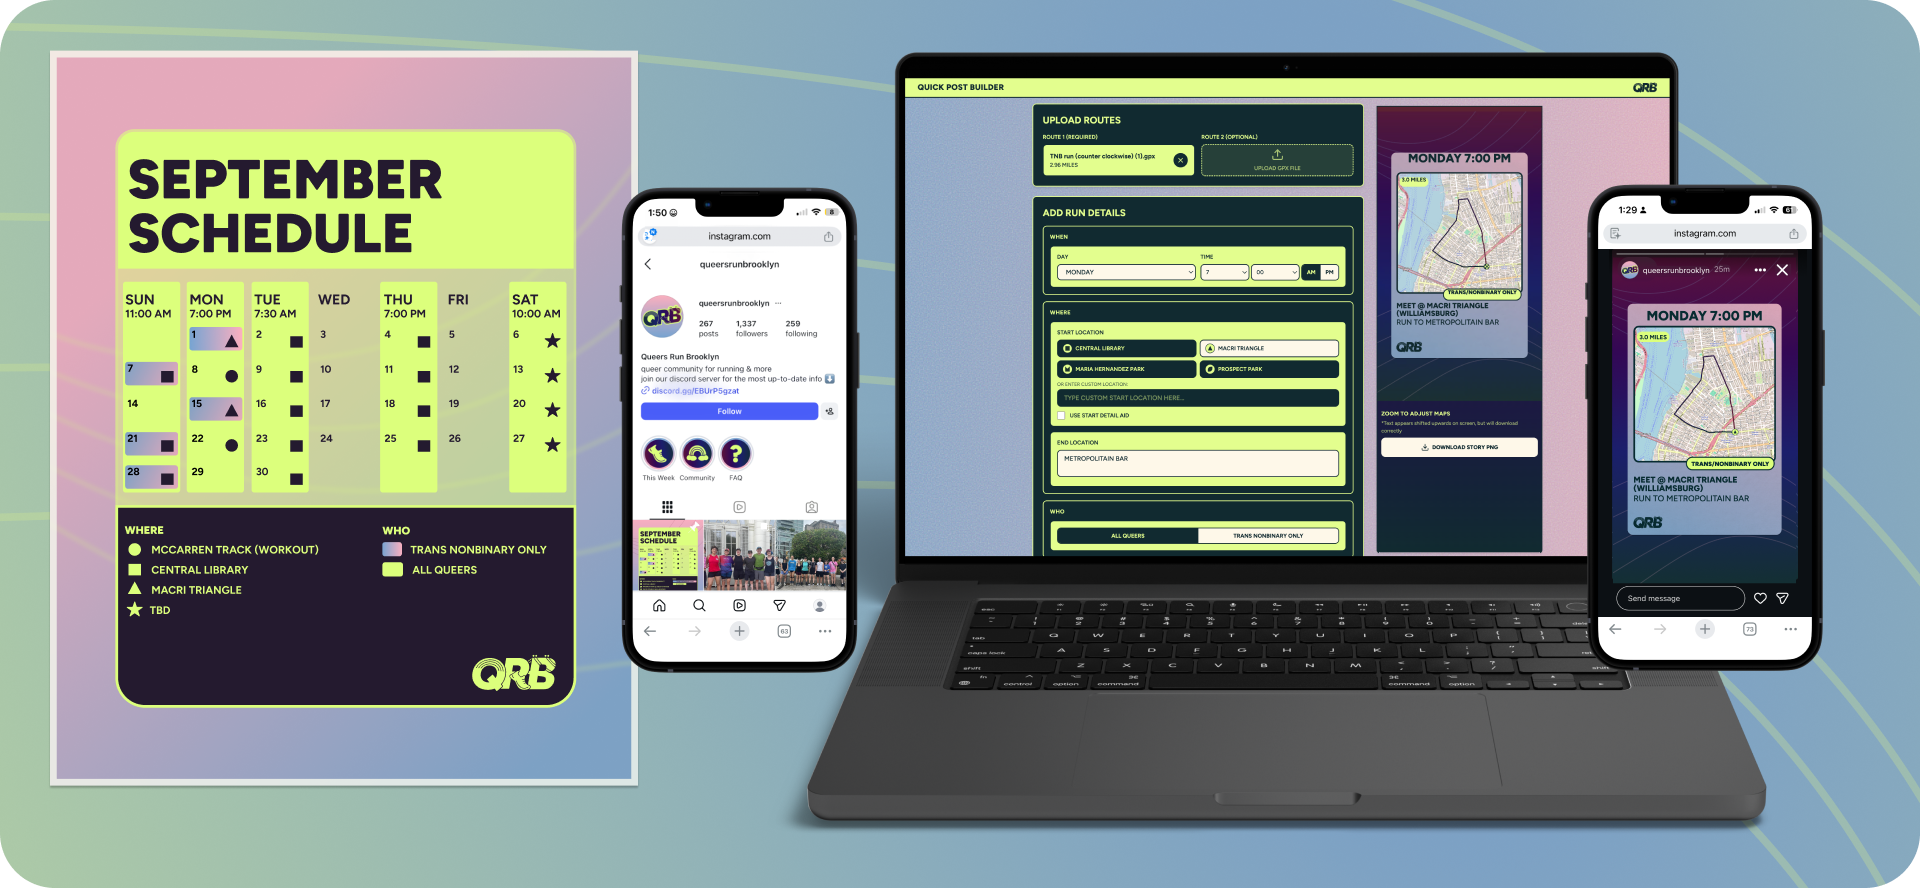
A well tested comprehensive communication system that ensures members get the information they need when they need it with as little friction for the social media chair as possible.
I finalized visuals and ensured mobile and web functionality for this final iteration.
.
Reflection
QRB has been running for two years now and I am proud to have built a comprehensive resilient system that continues to support a community that means a lot to me.
Looking back I am impressed by the range of impact I was able to deliver.
Ultimately, I am incredibly thankful to have been able to expand my understanding and my expertise while helping a community that I care about and who cares about me. This has been incredibly fulfilling.
.